
 Yahoo Finance
 Soilbuild Construction Group (SGX:S7P) delivers shareholders stellar 218% return over 1 year, surging 227% in the last week alone
Unless you borrow money to invest, the potential losses are limited. On the other hand, if you find a high quality business to buy (at the right price) you can more than double your money! For example, the Soilbuild Construction Group Ltd. (SGX:S7P) share price had more than doubled in just one year - up 209%. Shareholders are also celebrating an even better 248% rise, over the last three months. Also impressive, the stock is up 64% over three years, making long term shareholders happy, too.
Since it's been a strong week for Soilbuild Construction Group shareholders, let's have a look at trend of the longer term fundamentals.
View our latest analysis for Soilbuild Construction Group
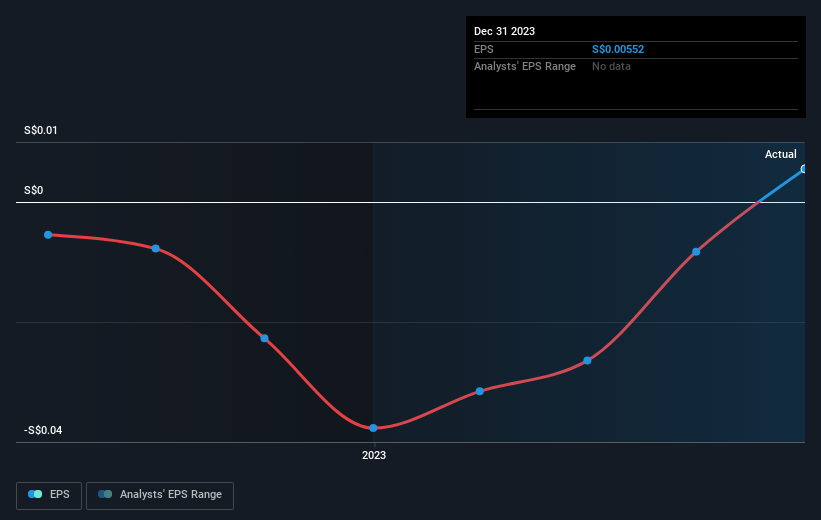
While markets are a powerful pricing mechanism, share prices reflect investor sentiment, not just underlying business performance. One imperfect but simple way to consider how the market perception of a company has shifted is to compare the change in the earnings per share (EPS) with the share price movement.
During the last year Soilbuild Construction Group grew its earnings per share, moving from a loss to a profit.
We think the growth looks very prospective, so we're not surprised the market liked it too. Inflection points like this can be a great time to take a closer look at a company.
The image below shows how EPS has tracked over time (if you click on the image you can see greater detail).
It might be well worthwhile taking a look at our free report on Soilbuild Construction Group's earnings, revenue and cash flow.
What About Dividends?
When looking at investment returns, it is important to consider the difference between total shareholder return (TSR) and share price return. The TSR is a return calculation that accounts for the value of cash dividends (assuming that any dividend received was reinvested) and the calculated value of any discounted capital raisings and spin-offs. Arguably, the TSR gives a more comprehensive picture of the return generated by a stock. We note that for Soilbuild Construction Group the TSR over the last 1 year was 218%, which is better than the share price return mentioned above. This is largely a result of its dividend payments!
A Different Perspective
It's good to see that Soilbuild Construction Group has rewarded shareholders with a total shareholder return of 218% in the last twelve months. And that does include the dividend. Since the one-year TSR is better than the five-year TSR (the latter coming in at 11% per year), it would seem that the stock's performance has improved in recent times. Given the share price momentum remains strong, it might be worth taking a closer look at the stock, lest you miss an opportunity. While it is well worth considering the different impacts that market conditions can have on the share price, there are other factors that are even more important. Case in point: We've spotted 2 warning signs for Soilbuild Construction Group you should be aware of.
But note: Soilbuild Construction Group may not be the best stock to buy. So take a peek at this free list of interesting companies with past earnings growth (and further growth forecast).
Please note, the market returns quoted in this article reflect the market weighted average returns of stocks that currently trade on Singaporean exchanges.
Have feedback on this article? Concerned about the content? Get in touch with us directly. Alternatively, email editorial-team (at) simplywallst.com.
This article by Simply Wall St is general in nature. We provide commentary based on historical data and analyst forecasts only using an unbiased methodology and our articles are not intended to be financial advice. It does not constitute a recommendation to buy or sell any stock, and does not take account of your objectives, or your financial situation. We aim to bring you long-term focused analysis driven by fundamental data. Note that our analysis may not factor in the latest price-sensitive company announcements or qualitative material. Simply Wall St has no position in any stocks mentioned.
Have feedback on this article? Concerned about the content? Get in touch with us directly. Alternatively, email editorial-team@simplywallst.com
