
 Yahoo Finance
 What Softrock Minerals Ltd.'s (CVE:SFT) P/E Is Not Telling You
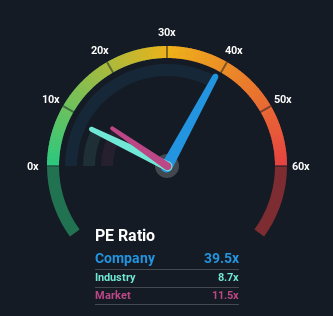
Softrock Minerals Ltd.'s (CVE:SFT) price-to-earnings (or "P/E") ratio of 39.5x might make it look like a strong sell right now compared to the market in Canada, where around half of the companies have P/E ratios below 11x and even P/E's below 5x are quite common. Nonetheless, we'd need to dig a little deeper to determine if there is a rational basis for the highly elevated P/E.
With earnings growth that's exceedingly strong of late, Softrock Minerals has been doing very well. It seems that many are expecting the strong earnings performance to beat most other companies over the coming period, which has increased investors’ willingness to pay up for the stock. You'd really hope so, otherwise you're paying a pretty hefty price for no particular reason.
See our latest analysis for Softrock Minerals
Although there are no analyst estimates available for Softrock Minerals, take a look at this free data-rich visualisation to see how the company stacks up on earnings, revenue and cash flow.
Is There Enough Growth For Softrock Minerals?
The only time you'd be truly comfortable seeing a P/E as steep as Softrock Minerals' is when the company's growth is on track to outshine the market decidedly.
Taking a look back first, we see that the company grew earnings per share by an impressive 54% last year. Although, its longer-term performance hasn't been as strong with three-year EPS growth being relatively non-existent overall. So it appears to us that the company has had a mixed result in terms of growing earnings over that time.
Comparing that to the market, which is predicted to deliver 13% growth in the next 12 months, the company's momentum is weaker based on recent medium-term annualised earnings results.
With this information, we find it concerning that Softrock Minerals is trading at a P/E higher than the market. Apparently many investors in the company are way more bullish than recent times would indicate and aren't willing to let go of their stock at any price. There's a good chance existing shareholders are setting themselves up for future disappointment if the P/E falls to levels more in line with recent growth rates.
The Key Takeaway
We'd say the price-to-earnings ratio's power isn't primarily as a valuation instrument but rather to gauge current investor sentiment and future expectations.
Our examination of Softrock Minerals revealed its three-year earnings trends aren't impacting its high P/E anywhere near as much as we would have predicted, given they look worse than current market expectations. When we see weak earnings with slower than market growth, we suspect the share price is at risk of declining, sending the high P/E lower. If recent medium-term earnings trends continue, it will place shareholders' investments at significant risk and potential investors in danger of paying an excessive premium.
It is also worth noting that we have found 4 warning signs for Softrock Minerals that you need to take into consideration.
It's important to make sure you look for a great company, not just the first idea you come across. So take a peek at this free list of interesting companies with strong recent earnings growth (and a P/E ratio below 20x).
Have feedback on this article? Concerned about the content? Get in touch with us directly. Alternatively, email editorial-team (at) simplywallst.com.
This article by Simply Wall St is general in nature. We provide commentary based on historical data and analyst forecasts only using an unbiased methodology and our articles are not intended to be financial advice. It does not constitute a recommendation to buy or sell any stock, and does not take account of your objectives, or your financial situation. We aim to bring you long-term focused analysis driven by fundamental data. Note that our analysis may not factor in the latest price-sensitive company announcements or qualitative material. Simply Wall St has no position in any stocks mentioned.
