
 Yahoo Finance
 Snap-on (SNA) Surpasses Earnings and Sales Estimates in Q3
Snap-on Inc. SNA has posted robust third-quarter 2021 results, wherein both top and bottom lines advanced year over year. Results gained from continued positive business momentum and contributions from its Value Creation plan. The company also noted that it progressed well beyond the pre-pandemic level of 2019 for the fifth successive time. Management also remains on track with its Rapid Continuous Improvement (RCI) process and other cost-reduction initiatives.
Shares of this Zacks Rank #3 (Hold) company have gained 3.5% in the past three months against the industry's 3.1% decline.
Q3 Highlights
Snap-on’s adjusted earnings of $3.57 per share in third-quarter 2021 surpassed the Zacks Consensus Estimate of $3.35. The figure was up 8.8% and 20.6% from adjusted earnings of $3.28 and $2.96 per share reported in third-quarter 2020 and 2019, respectively.
Net sales grew 10.2% to $1,037.7 million and beat the Zacks Consensus Estimate of $992 million. The uptick can be attributed to organic sales growth of 7%, a $9.6-million positive impact of foreign-currency translations and $19.5 million in contributions from acquisitions.
The top line also advanced 15.1% from third-quarter 2019’s reported figure of $901.8 million, driven by organic sales growth of 11.1%, gains from acquisitions of $21 million and $13.6 million of positive impact from foreign currency.
The adjusted gross profit was $520.7 million, up 10.9% year over year, while the adjusted gross margin advanced 50 basis points (bps) to 50.2% in the reported quarter.
The company’s adjusted operating earnings before financial services totaled $201.3 million, up 8.4% year over year. Meanwhile, the metric, as a percentage of sales, contracted 30 bps to 19.4% in the quarter under review.
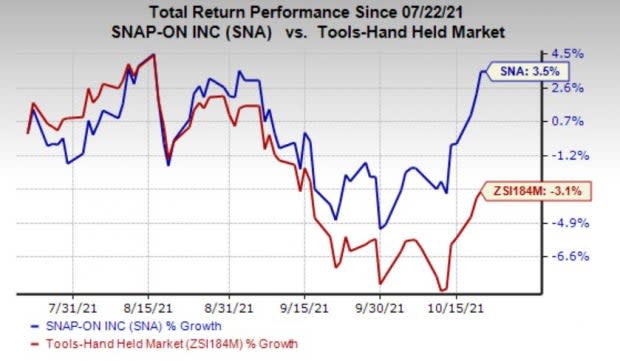
Image Source: Zacks Investment Research
Segmental Details
Sales in Commercial & Industrial Group increased 13.9% from the prior-year quarter to $351.4 million, driven by organic sales growth of 10.6%, a positive impact of $2.6 million from foreign currency and $7.5 million in gains from acquisitions. The top line also improved 4.8% from $335.3 million in third-quarter 2019 on the back of organic sales growth of 0.9%, $7.5 million contributions from acquisitions and $5.6 million of favorable foreign currency.
The Tools Group segment’s sales rose 4.8% year over year to $471.4 million, driven by organic sales growth of 3.7% and a $4.9-million positive impact of foreign currency. Solid sales performance for both U.S. and international operations aided results. Sales in the segment grew 22.4% from $385.2 million in third-quarter 2019, owing to 20.6% organic sales growth and $5.8 million from favorable currency movement.
Sales in Repair Systems & Information Group rallied 14.8% year over year to $398.6 million. Organic sales in the segment rose 9.9% from the year-ago quarter, with a $3.2 million positive impact from foreign currency and $12 million in gains from acquisitions.
Strength in diagnostics and repair information products to independent repair shop owners and managers as well as a rise in sales of under-car equipment contributed to segment growth. The top line witnessed growth of 12.9% from third-quarter 2019, driven by organic sales growth of 7.4%, a positive currency impact of $4 million and $13.5 million of gains from acquisitions.
The Financial Services business reported revenues of $87.3 million, up from $85.8 million in the year-ago quarter.
Financials
In the quarter, Snap-on’s cash and cash equivalents totaled $735.5 million, with long-term debt of $1,182.7 million and $4,047.3 million in shareholders’ equity.
SnapOn Incorporated Price, Consensus and EPS Surprise
SnapOn Incorporated price-consensus-eps-surprise-chart | SnapOn Incorporated Quote
Looking Ahead
Snap-on continues to reel under potential threats of new COVID-19 variants and supply-chain headwinds. It remains focused on expanding the customer base, particularly in automotive repair and critical industries. As a result, the capital expenditure for 2021 is projected to be $90 million, out of which $53.8 million has been incurred in the first nine months.
3 Stocks to Consider
PVH Corp PVH currently sports a Zacks Rank #1 (Strong Buy) and has a long-term earnings growth rate of 59.1%. You can see the complete list of today’s Zacks #1 Rank stocks here.
Carter’s CRI currently has an impressive long-term earnings growth rate of 21.1% and a Zacks Rank #2 (Buy).
Lululemon Athletica LULU has a long-term earnings growth rate of 20%. The company has a Zacks Rank #2 at present.
Want the latest recommendations from Zacks Investment Research? Today, you can download 7 Best Stocks for the Next 30 Days. Click to get this free report
SnapOn Incorporated (SNA) : Free Stock Analysis Report
lululemon athletica inc. (LULU) : Free Stock Analysis Report
PVH Corp. (PVH) : Free Stock Analysis Report
Carter's, Inc. (CRI) : Free Stock Analysis Report
To read this article on Zacks.com click here.
Zacks Investment Research
