Small but Mighty: Is the Russell 2000 Signaling a Comeback?
Small Caps and the Russell 2000 Index ETF (IWM) have lagged behind their large-cap counterparts for years. However, signs are emerging that that is likely to change. Below are the reasons why:
Inflation & Interest Rate Concerns are Subsiding
Due to their inherent characteristics, small-cap stocks are often more sensitive to inflation and interest rates. Smaller companies usually have limited resources, making them more vulnerable to rising operating costs during inflationary periods. Additionally, these firms face challenges adjusting product prices quickly to offset inflationary pressures. When inflation increases, the Federal Reserve raises interest rates to deal with it. Rising interest rates can adversely impact small caps as borrowing costs increase, squeezing their profit margins and making it more challenging for them to access capital. The combination of increased operating costs, perceived risk, and higher borrowing expenses has weighed on small caps over the past few years, but that appears to be changing.
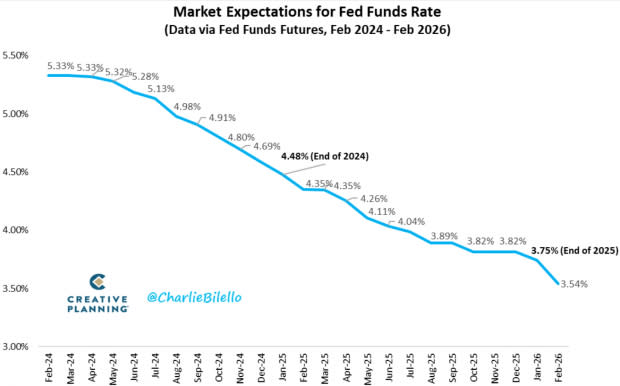
Yesterday morning, Core PCE (the U.S. Fed’s preferred measure of inflation) decreased to 2.8% in January, the lowest inflation rate since March 2021. Markets are now pricing in three interest rate cuts in 2024. A lower Fed Funds Rate is a bullish catalyst for small-cap stocks.

Image Source: Charlie Bilello, Creative Planning
Earnings are Turning the Corner
Until the back half of 2023, the Russell 2000’s earnings growth declined for four straight quarters. However, in Q3 and Q4 2024, they rebounded strongly, and Zacks Consensus Earnings Estimates suggest that the positive momentum will continue. The Russell’s year-over-year earnings are expected to grow a healthy 10% in 2024 and a robust 41% in 2025! Remember, markets tend to discount future earnings growth in advance.

Image Source: Zacks Investment Research
Price Action
Multi-time frame analysis
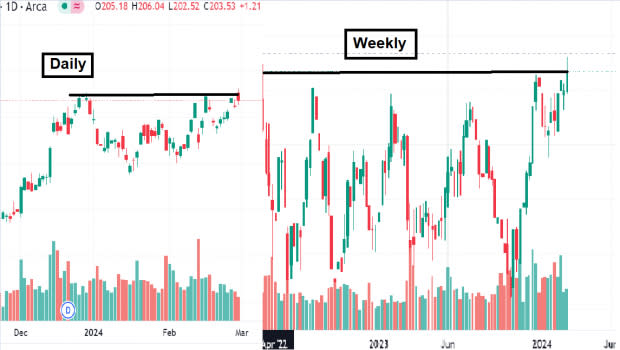
Mutti-timeframe analysis is an investment approach technicians use to simultaneously examine an asset across different time intervals. The idea behind MTFA is that the more timeframes you combine, the more well-rounded the technical assessment of an asset’s price action is and the higher the odds the trade works. Below is a daily and weekly comparison of the Russell 2000 Index ETF (IWM) as an example. The index also threatens to break out on the quarterly and yearly timeframes – a bullish sign.

Image Source: TradingView
Change of Character
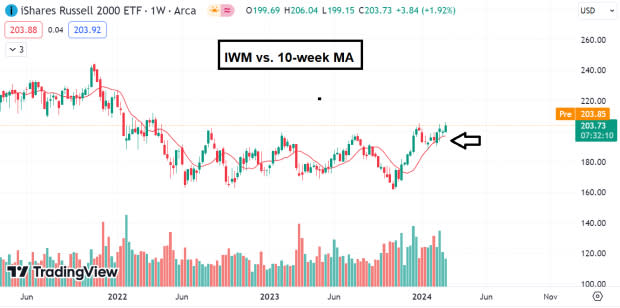
The 10-week moving average is the best proxy for the intermediate trend in stocks and ETFs. Unlike 2023, IWM is finding buying support at its 10-week moving average.

Image Source: TradingView
The Longer the Base, The Higher in Space?
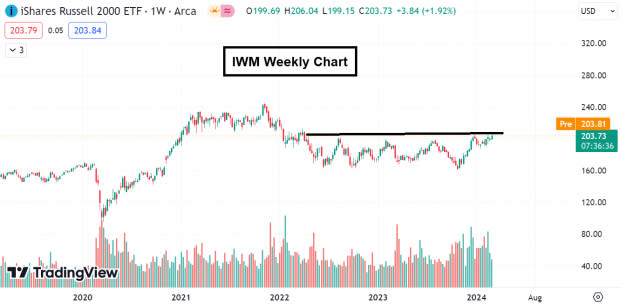
Super Micro Computer (SMCI) and several other stocks proved that long base breakouts produce some of the most robust uptrends. IWM is attempting to break out of a base structure that dates all the way back to April 2022.

Image Source: TradingView
Cash Rich
Despite the tumultuous performance over the past few years, small caps are cash-rich. The Russell 2000’s Net Cash / Market Cap Ratio is at decade highs, signaling fundamental strength in small caps.

Image Source: Zacks Investment Research
Bottom Line
Factors such as subsiding inflation and interest rate concerns, a turnaround in earnings growth, positive price action, as well as the cash-rich status of small caps, all contribute to a potential resurgence in small caps.
Want the latest recommendations from Zacks Investment Research? Today, you can download 7 Best Stocks for the Next 30 Days. Click to get this free report
Super Micro Computer, Inc. (SMCI) : Free Stock Analysis Report
iShares Russell 2000 ETF (IWM): ETF Research Reports

 Yahoo Finance