
 Yahoo Finance
 SMA Solar Technology (ETR:S92) Is Achieving High Returns On Its Capital
Did you know there are some financial metrics that can provide clues of a potential multi-bagger? One common approach is to try and find a company with returns on capital employed (ROCE) that are increasing, in conjunction with a growing amount of capital employed. Basically this means that a company has profitable initiatives that it can continue to reinvest in, which is a trait of a compounding machine. With that in mind, the ROCE of SMA Solar Technology (ETR:S92) looks great, so lets see what the trend can tell us.
What Is Return On Capital Employed (ROCE)?
For those who don't know, ROCE is a measure of a company's yearly pre-tax profit (its return), relative to the capital employed in the business. The formula for this calculation on SMA Solar Technology is:
Return on Capital Employed = Earnings Before Interest and Tax (EBIT) ÷ (Total Assets - Current Liabilities)
0.21 = €192m ÷ (€1.6b - €647m) (Based on the trailing twelve months to September 2023).
Thus, SMA Solar Technology has an ROCE of 21%. That's a fantastic return and not only that, it outpaces the average of 16% earned by companies in a similar industry.
Check out our latest analysis for SMA Solar Technology
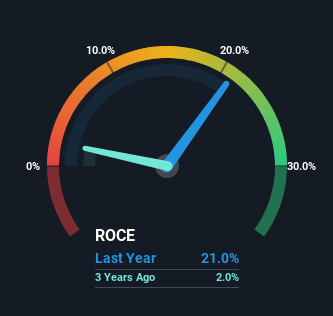
Above you can see how the current ROCE for SMA Solar Technology compares to its prior returns on capital, but there's only so much you can tell from the past. If you're interested, you can view the analysts predictions in our free report on analyst forecasts for the company.
How Are Returns Trending?
SMA Solar Technology's ROCE growth is quite impressive. Looking at the data, we can see that even though capital employed in the business has remained relatively flat, the ROCE generated has risen by 304% over the last five years. So our take on this is that the business has increased efficiencies to generate these higher returns, all the while not needing to make any additional investments. On that front, things are looking good so it's worth exploring what management has said about growth plans going forward.
For the record though, there was a noticeable increase in the company's current liabilities over the period, so we would attribute some of the ROCE growth to that. The current liabilities has increased to 41% of total assets, so the business is now more funded by the likes of its suppliers or short-term creditors. Given it's pretty high ratio, we'd remind investors that having current liabilities at those levels can bring about some risks in certain businesses.
The Key Takeaway
To bring it all together, SMA Solar Technology has done well to increase the returns it's generating from its capital employed. And a remarkable 146% total return over the last five years tells us that investors are expecting more good things to come in the future. With that being said, we still think the promising fundamentals mean the company deserves some further due diligence.
One final note, you should learn about the 3 warning signs we've spotted with SMA Solar Technology (including 2 which don't sit too well with us) .
If you'd like to see other companies earning high returns, check out our free list of companies earning high returns with solid balance sheets here.
Have feedback on this article? Concerned about the content? Get in touch with us directly. Alternatively, email editorial-team (at) simplywallst.com.
This article by Simply Wall St is general in nature. We provide commentary based on historical data and analyst forecasts only using an unbiased methodology and our articles are not intended to be financial advice. It does not constitute a recommendation to buy or sell any stock, and does not take account of your objectives, or your financial situation. We aim to bring you long-term focused analysis driven by fundamental data. Note that our analysis may not factor in the latest price-sensitive company announcements or qualitative material. Simply Wall St has no position in any stocks mentioned.
