
 Yahoo Finance
 SM Energy (SM) Q2 Earnings Beat on Higher Crude Oil Prices
SM Energy Company SM reported second-quarter adjusted earnings of a penny versus the Zacks Consensus Estimate of a loss of 20 cents per share. The bottom line also improved from a loss of 15 cents per share in the year-ago period.
Quarterly revenues of $563.8 million increased from $169.6 million in the year-ago quarter and beat the Zacks Consensus Estimate of $401 million.
The strong quarterly results can be attributed to an increase in realized commodity prices, and oil and gas production volumes.
SM Energy Company Price, Consensus and EPS Surprise
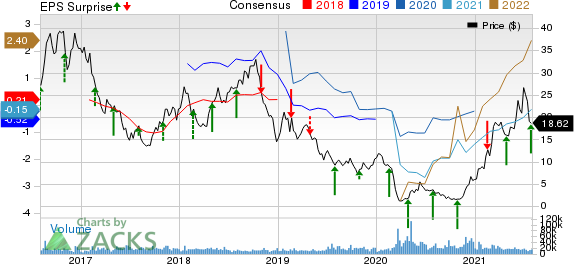
SM Energy Company price-consensus-eps-surprise-chart | SM Energy Company Quote
Operational Performance
Production
SM Energy’s second-quarter production totaled 136.5 thousand barrels of oil equivalent per day (MBoe/d) (53.8% oil), up 11% from the year-ago level of 122.9 MBoe/d. Increased production was favored by Austin Chalk performances.
Oil production increased 24% year over year to 73.4 thousand barrels per day (MBbls/d). The company produced 290.9 million cubic feet per day of natural gas in the quarter, up 2% year over year. Natural gas liquids contributed 14.6 MBbls/d to total production volume, down 10% from the second-quarter 2020 level.
Realized Prices
Before the effects of derivative settlements, the average realized price per Boe was $45.28 compared with $15.18 in the year-ago quarter. Average realized price of natural gas surged 149% year over year to $3.34 per thousand cubic feet. Also, average realized prices of oil increased 194% to $65.34 per barrel and that of natural gas liquids grew 172% from the prior-year quarter to $28.41.
Cost & Expenses
On the cost front, unit lease operating expenses increased 40% year over year to $4.62 per Boe. Transportation expenses, however, fell to $3.01 per Boe from $3.12 in the year-ago quarter. Also, general and administrative expenses decreased 19% to $1.98 per Boe from the prior-year level of $2.43.
Total hydrocarbon production expenses for the quarter were recorded at $125.5 million compared with the year-ago level of $80.4 million. Total exploration expenses were $8.7 million, lower than the year-ago figure of $9.8 million.
Total operating expenses for the second quarter increased to $744.5 million from the year-ago period’s $482.3 million.
Capex
Capital expenditure for the June quarter was recorded at $222.6 million, higher than the year-ago figure of $170.9 million. It generated free cash outflow of $0.3 million in the quarter versus the year-ago free cash flow figure of $27.9 million.
Balance Sheet
As of Jun 30, 2021, the company had $2,254.6 million in net debt but no cash and cash equivalents. It had total liquidity of $1.05 billion.
Guidance
SM Energy's 2021 capital expenditure guidance is reiterated at $650-$675 million. Total production guidance has been narrowed to the range of 130.1-135.6 MBoe/d, signaling a rise from the 2020 level of 126.9 MBoe/d. Of the total output, 52-53% will likely be oil.
For 2021, the company reiterated lease operating expense within $4.50-$5 per Boe, indicating a significant rise from the 2020 level of $3.97. Transportation costs will likely be in the range of $2.80-$3 per Boe, suggesting a decline from the 2020 figure of $3.06 per Boe. Exploration expense for 2021 is expected to be $50 million, of which around $18 million was used in the first half of the year.
For third quarter, production is expected within 141-143 Mboe/d, of which 53-54% will likely be oil. Capital expenditure for the September quarter is projected in the range of $170-$190 million.
Zacks Rank & Other Stocks to Consider
The company currently sports a Zacks Rank #1 (Strong Buy). Other top-ranked stocks from the energy space include Range Resources Corporation RRC, Southwestern Energy Company SWN and Braskem S.A. BAK, each having a Zacks Rank #2 (Buy). You can see the complete list of today’s Zacks #1 Rank stocks here.
The Zacks Consensus Estimate for Range Resources’ earnings for 2021 is pegged at $1.53 per share, indicting a massive improvement from the year-ago loss of 9 cents.
Southwestern’s profits for 2021 are expected to jump 202.6% year over year.
Braskem’s bottom line for 2021 is expected to surge 326.7% year over year.
Want the latest recommendations from Zacks Investment Research? Today, you can download 7 Best Stocks for the Next 30 Days. Click to get this free report
Range Resources Corporation (RRC) : Free Stock Analysis Report
Southwestern Energy Company (SWN) : Free Stock Analysis Report
SM Energy Company (SM) : Free Stock Analysis Report
Braskem S.A. (BAK) : Free Stock Analysis Report
To read this article on Zacks.com click here.
Zacks Investment Research
