
 Yahoo Finance
 SM Energy Company's (NYSE:SM) Stock Is Going Strong: Have Financials A Role To Play?
Most readers would already be aware that SM Energy's (NYSE:SM) stock increased significantly by 8.9% over the past month. As most would know, fundamentals are what usually guide market price movements over the long-term, so we decided to look at the company's key financial indicators today to determine if they have any role to play in the recent price movement. Specifically, we decided to study SM Energy's ROE in this article.
Return on equity or ROE is a key measure used to assess how efficiently a company's management is utilizing the company's capital. In simpler terms, it measures the profitability of a company in relation to shareholder's equity.
View our latest analysis for SM Energy
How To Calculate Return On Equity?
The formula for return on equity is:
Return on Equity = Net Profit (from continuing operations) ÷ Shareholders' Equity
So, based on the above formula, the ROE for SM Energy is:
36% = US$883m ÷ US$2.4b (Based on the trailing twelve months to June 2022).
The 'return' is the income the business earned over the last year. So, this means that for every $1 of its shareholder's investments, the company generates a profit of $0.36.
Why Is ROE Important For Earnings Growth?
Thus far, we have learned that ROE measures how efficiently a company is generating its profits. Based on how much of its profits the company chooses to reinvest or "retain", we are then able to evaluate a company's future ability to generate profits. Assuming everything else remains unchanged, the higher the ROE and profit retention, the higher the growth rate of a company compared to companies that don't necessarily bear these characteristics.
SM Energy's Earnings Growth And 36% ROE
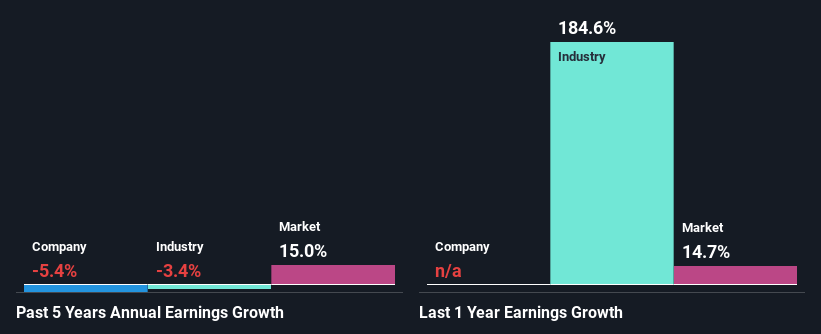
First thing first, we like that SM Energy has an impressive ROE. Additionally, the company's ROE is higher compared to the industry average of 26% which is quite remarkable. For this reason, SM Energy's five year net income decline of 5.4% raises the question as to why the high ROE didn't translate into earnings growth. So, there might be some other aspects that could explain this. For example, it could be that the company has a high payout ratio or the business has allocated capital poorly, for instance.
Furthermore, even when compared to the industry, which has been shrinking its earnings at a rate 3.4% in the same period, we found that SM Energy's performance is pretty disappointing, as it suggests that the company has been shrunk its earnings at a rate faster than the industry.
The basis for attaching value to a company is, to a great extent, tied to its earnings growth. It’s important for an investor to know whether the market has priced in the company's expected earnings growth (or decline). Doing so will help them establish if the stock's future looks promising or ominous. If you're wondering about SM Energy's's valuation, check out this gauge of its price-to-earnings ratio, as compared to its industry.
Is SM Energy Using Its Retained Earnings Effectively?
SM Energy's low LTM (or last twelve month) payout ratio of 0.3% (or a retention ratio of 100%) over the last three years should mean that the company is retaining most of its earnings to fuel its growth but the company's earnings have actually shrunk. The low payout should mean that the company is retaining most of its earnings and consequently, should see some growth. It looks like there might be some other reasons to explain the lack in that respect. For example, the business could be in decline.
Moreover, SM Energy has been paying dividends for at least ten years or more suggesting that management must have perceived that the shareholders prefer dividends over earnings growth. Based on the latest analysts' estimates, we found that the company's future payout ratio over the next three years is expected to hold steady at 0.2%. Regardless, SM Energy's ROE is speculated to decline to 26% despite there being no anticipated change in its payout ratio.
Conclusion
On the whole, we do feel that SM Energy has some positive attributes. However, given the high ROE and high profit retention, we would expect the company to be delivering strong earnings growth, but that isn't the case here. This suggests that there might be some external threat to the business, that's hampering its growth. That being so, the latest industry analyst forecasts show that the analysts are expecting to see a huge improvement in the company's earnings growth rate. Are these analysts expectations based on the broad expectations for the industry, or on the company's fundamentals? Click here to be taken to our analyst's forecasts page for the company.
Have feedback on this article? Concerned about the content? Get in touch with us directly. Alternatively, email editorial-team (at) simplywallst.com.
This article by Simply Wall St is general in nature. We provide commentary based on historical data and analyst forecasts only using an unbiased methodology and our articles are not intended to be financial advice. It does not constitute a recommendation to buy or sell any stock, and does not take account of your objectives, or your financial situation. We aim to bring you long-term focused analysis driven by fundamental data. Note that our analysis may not factor in the latest price-sensitive company announcements or qualitative material. Simply Wall St has no position in any stocks mentioned.
Join A Paid User Research Session
You’ll receive a US$30 Amazon Gift card for 1 hour of your time while helping us build better investing tools for the individual investors like yourself. Sign up here
