
 Yahoo Finance
 Slowing Rates Of Return At Vail Resorts (NYSE:MTN) Leave Little Room For Excitement
If we want to find a stock that could multiply over the long term, what are the underlying trends we should look for? Firstly, we'd want to identify a growing return on capital employed (ROCE) and then alongside that, an ever-increasing base of capital employed. If you see this, it typically means it's a company with a great business model and plenty of profitable reinvestment opportunities. That's why when we briefly looked at Vail Resorts' (NYSE:MTN) ROCE trend, we were pretty happy with what we saw.
What Is Return On Capital Employed (ROCE)?
If you haven't worked with ROCE before, it measures the 'return' (pre-tax profit) a company generates from capital employed in its business. Analysts use this formula to calculate it for Vail Resorts:
Return on Capital Employed = Earnings Before Interest and Tax (EBIT) ÷ (Total Assets - Current Liabilities)
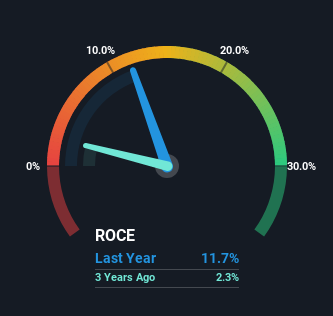
0.12 = US$542m ÷ (US$5.8b - US$1.2b) (Based on the trailing twelve months to January 2024).
So, Vail Resorts has an ROCE of 12%. In absolute terms, that's a satisfactory return, but compared to the Hospitality industry average of 9.5% it's much better.
View our latest analysis for Vail Resorts
In the above chart we have measured Vail Resorts' prior ROCE against its prior performance, but the future is arguably more important. If you'd like, you can check out the forecasts from the analysts covering Vail Resorts for free.
So How Is Vail Resorts' ROCE Trending?
The trend of ROCE doesn't stand out much, but returns on a whole are decent. Over the past five years, ROCE has remained relatively flat at around 12% and the business has deployed 33% more capital into its operations. Since 12% is a moderate ROCE though, it's good to see a business can continue to reinvest at these decent rates of return. Stable returns in this ballpark can be unexciting, but if they can be maintained over the long run, they often provide nice rewards to shareholders.
The Bottom Line On Vail Resorts' ROCE
In the end, Vail Resorts has proven its ability to adequately reinvest capital at good rates of return. And given the stock has only risen 1.8% over the last five years, we'd suspect the market is beginning to recognize these trends. So to determine if Vail Resorts is a multi-bagger going forward, we'd suggest digging deeper into the company's other fundamentals.
One final note, you should learn about the 2 warning signs we've spotted with Vail Resorts (including 1 which shouldn't be ignored) .
For those who like to invest in solid companies, check out this free list of companies with solid balance sheets and high returns on equity.
Have feedback on this article? Concerned about the content? Get in touch with us directly. Alternatively, email editorial-team (at) simplywallst.com.
This article by Simply Wall St is general in nature. We provide commentary based on historical data and analyst forecasts only using an unbiased methodology and our articles are not intended to be financial advice. It does not constitute a recommendation to buy or sell any stock, and does not take account of your objectives, or your financial situation. We aim to bring you long-term focused analysis driven by fundamental data. Note that our analysis may not factor in the latest price-sensitive company announcements or qualitative material. Simply Wall St has no position in any stocks mentioned.
