
 Yahoo Finance
 Slowing Rates Of Return At Stryker (NYSE:SYK) Leave Little Room For Excitement
What trends should we look for it we want to identify stocks that can multiply in value over the long term? Firstly, we'll want to see a proven return on capital employed (ROCE) that is increasing, and secondly, an expanding base of capital employed. If you see this, it typically means it's a company with a great business model and plenty of profitable reinvestment opportunities. With that in mind, the ROCE of Stryker (NYSE:SYK) looks decent, right now, so lets see what the trend of returns can tell us.
Return On Capital Employed (ROCE): What Is It?
If you haven't worked with ROCE before, it measures the 'return' (pre-tax profit) a company generates from capital employed in its business. The formula for this calculation on Stryker is:
Return on Capital Employed = Earnings Before Interest and Tax (EBIT) ÷ (Total Assets - Current Liabilities)
0.14 = US$4.4b ÷ (US$39b - US$7.0b) (Based on the trailing twelve months to March 2024).
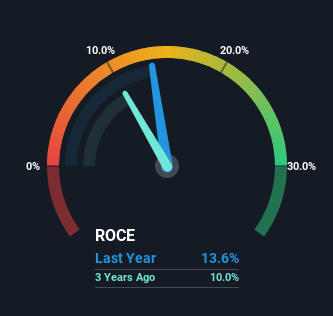
Therefore, Stryker has an ROCE of 14%. In absolute terms, that's a satisfactory return, but compared to the Medical Equipment industry average of 10% it's much better.
View our latest analysis for Stryker
In the above chart we have measured Stryker's prior ROCE against its prior performance, but the future is arguably more important. If you'd like, you can check out the forecasts from the analysts covering Stryker for free.
What Does the ROCE Trend For Stryker Tell Us?
While the current returns on capital are decent, they haven't changed much. The company has employed 46% more capital in the last five years, and the returns on that capital have remained stable at 14%. 14% is a pretty standard return, and it provides some comfort knowing that Stryker has consistently earned this amount. Stable returns in this ballpark can be unexciting, but if they can be maintained over the long run, they often provide nice rewards to shareholders.
What We Can Learn From Stryker's ROCE
To sum it up, Stryker has simply been reinvesting capital steadily, at those decent rates of return. And the stock has followed suit returning a meaningful 83% to shareholders over the last five years. So even though the stock might be more "expensive" than it was before, we think the strong fundamentals warrant this stock for further research.
One more thing, we've spotted 2 warning signs facing Stryker that you might find interesting.
While Stryker isn't earning the highest return, check out this free list of companies that are earning high returns on equity with solid balance sheets.
Have feedback on this article? Concerned about the content? Get in touch with us directly. Alternatively, email editorial-team (at) simplywallst.com.
This article by Simply Wall St is general in nature. We provide commentary based on historical data and analyst forecasts only using an unbiased methodology and our articles are not intended to be financial advice. It does not constitute a recommendation to buy or sell any stock, and does not take account of your objectives, or your financial situation. We aim to bring you long-term focused analysis driven by fundamental data. Note that our analysis may not factor in the latest price-sensitive company announcements or qualitative material. Simply Wall St has no position in any stocks mentioned.
