
 Yahoo Finance
 Slowing Rates Of Return At Shoals Technologies Group (NASDAQ:SHLS) Leave Little Room For Excitement
If we want to find a stock that could multiply over the long term, what are the underlying trends we should look for? Firstly, we'll want to see a proven return on capital employed (ROCE) that is increasing, and secondly, an expanding base of capital employed. If you see this, it typically means it's a company with a great business model and plenty of profitable reinvestment opportunities. In light of that, when we looked at Shoals Technologies Group (NASDAQ:SHLS) and its ROCE trend, we weren't exactly thrilled.
Return On Capital Employed (ROCE): What Is It?
For those who don't know, ROCE is a measure of a company's yearly pre-tax profit (its return), relative to the capital employed in the business. The formula for this calculation on Shoals Technologies Group is:
Return on Capital Employed = Earnings Before Interest and Tax (EBIT) ÷ (Total Assets - Current Liabilities)
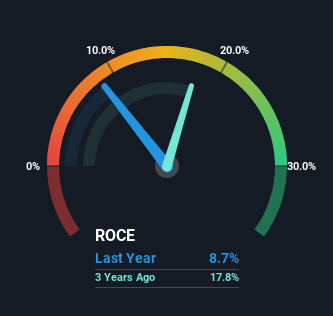
0.087 = US$65m ÷ (US$825m - US$80m) (Based on the trailing twelve months to March 2024).
Thus, Shoals Technologies Group has an ROCE of 8.7%. Ultimately, that's a low return and it under-performs the Electrical industry average of 13%.
See our latest analysis for Shoals Technologies Group
In the above chart we have measured Shoals Technologies Group's prior ROCE against its prior performance, but the future is arguably more important. If you'd like to see what analysts are forecasting going forward, you should check out our free analyst report for Shoals Technologies Group .
What Does the ROCE Trend For Shoals Technologies Group Tell Us?
There are better returns on capital out there than what we're seeing at Shoals Technologies Group. The company has consistently earned 8.7% for the last five years, and the capital employed within the business has risen 335% in that time. This poor ROCE doesn't inspire confidence right now, and with the increase in capital employed, it's evident that the business isn't deploying the funds into high return investments.
What We Can Learn From Shoals Technologies Group's ROCE
As we've seen above, Shoals Technologies Group's returns on capital haven't increased but it is reinvesting in the business. It seems that investors have little hope of these trends getting any better and that may have partly contributed to the stock collapsing 82% in the last three years. On the whole, we aren't too inspired by the underlying trends and we think there may be better chances of finding a multi-bagger elsewhere.
On a separate note, we've found 1 warning sign for Shoals Technologies Group you'll probably want to know about.
While Shoals Technologies Group may not currently earn the highest returns, we've compiled a list of companies that currently earn more than 25% return on equity. Check out this free list here.
Have feedback on this article? Concerned about the content? Get in touch with us directly. Alternatively, email editorial-team (at) simplywallst.com.
This article by Simply Wall St is general in nature. We provide commentary based on historical data and analyst forecasts only using an unbiased methodology and our articles are not intended to be financial advice. It does not constitute a recommendation to buy or sell any stock, and does not take account of your objectives, or your financial situation. We aim to bring you long-term focused analysis driven by fundamental data. Note that our analysis may not factor in the latest price-sensitive company announcements or qualitative material. Simply Wall St has no position in any stocks mentioned.
Have feedback on this article? Concerned about the content? Get in touch with us directly. Alternatively, email editorial-team@simplywallst.com
