
 Yahoo Finance
 Slowing Rates Of Return At Pizza Pizza Royalty (TSE:PZA) Leave Little Room For Excitement
To find a multi-bagger stock, what are the underlying trends we should look for in a business? Ideally, a business will show two trends; firstly a growing return on capital employed (ROCE) and secondly, an increasing amount of capital employed. Put simply, these types of businesses are compounding machines, meaning they are continually reinvesting their earnings at ever-higher rates of return. However, after briefly looking over the numbers, we don't think Pizza Pizza Royalty (TSE:PZA) has the makings of a multi-bagger going forward, but let's have a look at why that may be.
Understanding Return On Capital Employed (ROCE)
If you haven't worked with ROCE before, it measures the 'return' (pre-tax profit) a company generates from capital employed in its business. The formula for this calculation on Pizza Pizza Royalty is:
Return on Capital Employed = Earnings Before Interest and Tax (EBIT) ÷ (Total Assets - Current Liabilities)
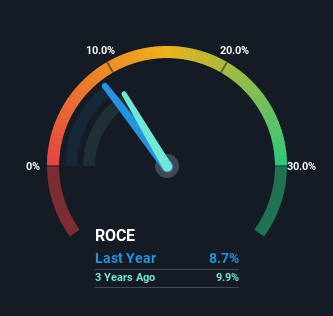
0.087 = CA$31m ÷ (CA$363m - CA$2.8m) (Based on the trailing twelve months to December 2021).
Thus, Pizza Pizza Royalty has an ROCE of 8.7%. Even though it's in line with the industry average of 8.7%, it's still a low return by itself.
Check out our latest analysis for Pizza Pizza Royalty
In the above chart we have measured Pizza Pizza Royalty's prior ROCE against its prior performance, but the future is arguably more important. If you'd like to see what analysts are forecasting going forward, you should check out our free report for Pizza Pizza Royalty.
So How Is Pizza Pizza Royalty's ROCE Trending?
Things have been pretty stable at Pizza Pizza Royalty, with its capital employed and returns on that capital staying somewhat the same for the last five years. This tells us the company isn't reinvesting in itself, so it's plausible that it's past the growth phase. So unless we see a substantial change at Pizza Pizza Royalty in terms of ROCE and additional investments being made, we wouldn't hold our breath on it being a multi-bagger.
In Conclusion...
In a nutshell, Pizza Pizza Royalty has been trudging along with the same returns from the same amount of capital over the last five years. And with the stock having returned a mere 4.7% in the last five years to shareholders, you could argue that they're aware of these lackluster trends. So if you're looking for a multi-bagger, the underlying trends indicate you may have better chances elsewhere.
One more thing to note, we've identified 2 warning signs with Pizza Pizza Royalty and understanding these should be part of your investment process.
While Pizza Pizza Royalty may not currently earn the highest returns, we've compiled a list of companies that currently earn more than 25% return on equity. Check out this free list here.
Have feedback on this article? Concerned about the content? Get in touch with us directly. Alternatively, email editorial-team (at) simplywallst.com.
This article by Simply Wall St is general in nature. We provide commentary based on historical data and analyst forecasts only using an unbiased methodology and our articles are not intended to be financial advice. It does not constitute a recommendation to buy or sell any stock, and does not take account of your objectives, or your financial situation. We aim to bring you long-term focused analysis driven by fundamental data. Note that our analysis may not factor in the latest price-sensitive company announcements or qualitative material. Simply Wall St has no position in any stocks mentioned.
