
 Yahoo Finance
 Slowing Rates Of Return At Electrocomponents (LON:ECM) Leave Little Room For Excitement
There are a few key trends to look for if we want to identify the next multi-bagger. Typically, we'll want to notice a trend of growing return on capital employed (ROCE) and alongside that, an expanding base of capital employed. Ultimately, this demonstrates that it's a business that is reinvesting profits at increasing rates of return. That's why when we briefly looked at Electrocomponents' (LON:ECM) ROCE trend, we were pretty happy with what we saw.
Understanding Return On Capital Employed (ROCE)
For those who don't know, ROCE is a measure of a company's yearly pre-tax profit (its return), relative to the capital employed in the business. Analysts use this formula to calculate it for Electrocomponents:
Return on Capital Employed = Earnings Before Interest and Tax (EBIT) ÷ (Total Assets - Current Liabilities)
0.19 = UK£250m ÷ (UK£1.9b - UK£643m) (Based on the trailing twelve months to September 2021).
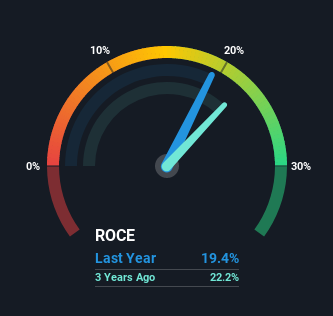
So, Electrocomponents has an ROCE of 19%. On its own, that's a standard return, however it's much better than the 14% generated by the Trade Distributors industry.
Check out our latest analysis for Electrocomponents
Above you can see how the current ROCE for Electrocomponents compares to its prior returns on capital, but there's only so much you can tell from the past. If you're interested, you can view the analysts predictions in our free report on analyst forecasts for the company.
What Does the ROCE Trend For Electrocomponents Tell Us?
While the returns on capital are good, they haven't moved much. Over the past five years, ROCE has remained relatively flat at around 19% and the business has deployed 98% more capital into its operations. 19% is a pretty standard return, and it provides some comfort knowing that Electrocomponents has consistently earned this amount. Stable returns in this ballpark can be unexciting, but if they can be maintained over the long run, they often provide nice rewards to shareholders.
The Bottom Line On Electrocomponents' ROCE
The main thing to remember is that Electrocomponents has proven its ability to continually reinvest at respectable rates of return. And the stock has done incredibly well with a 143% return over the last five years, so long term investors are no doubt ecstatic with that result. So even though the stock might be more "expensive" than it was before, we think the strong fundamentals warrant this stock for further research.
Electrocomponents could be trading at an attractive price in other respects, so you might find our free intrinsic value estimation on our platform quite valuable.
While Electrocomponents may not currently earn the highest returns, we've compiled a list of companies that currently earn more than 25% return on equity. Check out this free list here.
Have feedback on this article? Concerned about the content? Get in touch with us directly. Alternatively, email editorial-team (at) simplywallst.com.
This article by Simply Wall St is general in nature. We provide commentary based on historical data and analyst forecasts only using an unbiased methodology and our articles are not intended to be financial advice. It does not constitute a recommendation to buy or sell any stock, and does not take account of your objectives, or your financial situation. We aim to bring you long-term focused analysis driven by fundamental data. Note that our analysis may not factor in the latest price-sensitive company announcements or qualitative material. Simply Wall St has no position in any stocks mentioned.