
 Yahoo Finance
 A Sliding Share Price Has Us Looking At NFI Group Inc.'s (TSE:NFI) P/E Ratio

Unfortunately for some shareholders, the NFI Group (TSE:NFI) share price has dived 33% in the last thirty days. Even longer term holders have taken a real hit with the stock declining 27% in the last year.
Assuming nothing else has changed, a lower share price makes a stock more attractive to potential buyers. In the long term, share prices tend to follow earnings per share, but in the short term prices bounce around in response to short term factors (which are not always obvious). So, on certain occasions, long term focussed investors try to take advantage of pessimistic expectations to buy shares at a better price. One way to gauge market expectations of a stock is to look at its Price to Earnings Ratio (PE Ratio). A high P/E implies that investors have high expectations of what a company can achieve compared to a company with a low P/E ratio.
Check out our latest analysis for NFI Group
How Does NFI Group's P/E Ratio Compare To Its Peers?
We can tell from its P/E ratio of 15.21 that sentiment around NFI Group isn't particularly high. We can see in the image below that the average P/E (19.4) for companies in the machinery industry is higher than NFI Group's P/E.
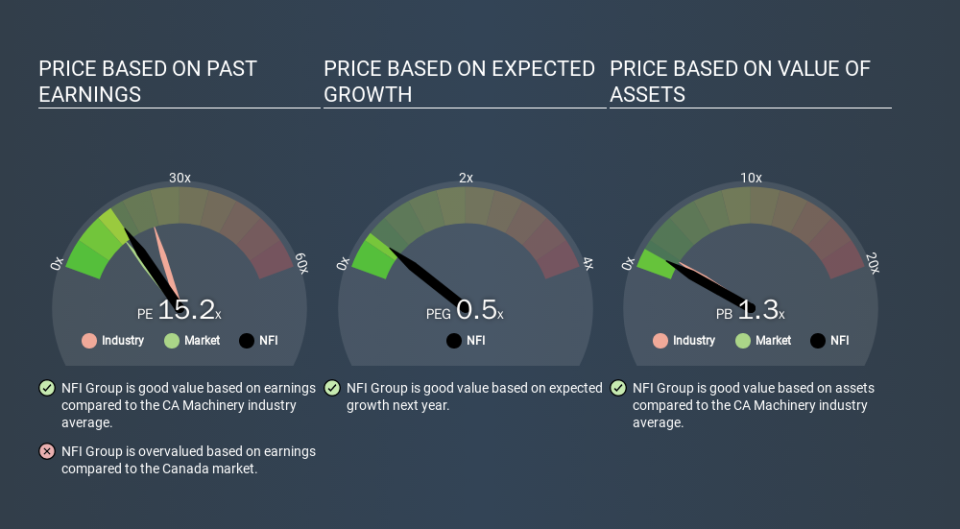
Its relatively low P/E ratio indicates that NFI Group shareholders think it will struggle to do as well as other companies in its industry classification. Since the market seems unimpressed with NFI Group, it's quite possible it could surprise on the upside. You should delve deeper. I like to check if company insiders have been buying or selling.
How Growth Rates Impact P/E Ratios
If earnings fall then in the future the 'E' will be lower. That means unless the share price falls, the P/E will increase in a few years. A higher P/E should indicate the stock is expensive relative to others -- and that may encourage shareholders to sell.
NFI Group's earnings per share fell by 65% in the last twelve months. But EPS is up 13% over the last 5 years. And it has shrunk its earnings per share by 14% per year over the last three years. This might lead to low expectations.
Don't Forget: The P/E Does Not Account For Debt or Bank Deposits
The 'Price' in P/E reflects the market capitalization of the company. In other words, it does not consider any debt or cash that the company may have on the balance sheet. Hypothetically, a company could reduce its future P/E ratio by spending its cash (or taking on debt) to achieve higher earnings.
Such expenditure might be good or bad, in the long term, but the point here is that the balance sheet is not reflected by this ratio.
How Does NFI Group's Debt Impact Its P/E Ratio?
NFI Group has net debt worth a very significant 114% of its market capitalization. This level of debt justifies a relatively low P/E, so remain cognizant of the debt, if you're comparing it to other stocks.
The Verdict On NFI Group's P/E Ratio
NFI Group's P/E is 15.2 which is above average (11.6) in its market. With relatively high debt, and no earnings per share growth over twelve months, it's safe to say the market believes the company will improve its earnings growth in the future. What can be absolutely certain is that the market has become significantly less optimistic about NFI Group over the last month, with the P/E ratio falling from 22.6 back then to 15.2 today. For those who prefer to invest with the flow of momentum, that might be a bad sign, but for a contrarian, it may signal opportunity.
When the market is wrong about a stock, it gives savvy investors an opportunity. As value investor Benjamin Graham famously said, 'In the short run, the market is a voting machine but in the long run, it is a weighing machine. So this free visual report on analyst forecasts could hold the key to an excellent investment decision.
Of course, you might find a fantastic investment by looking at a few good candidates. So take a peek at this free list of companies with modest (or no) debt, trading on a P/E below 20.
If you spot an error that warrants correction, please contact the editor at editorial-team@simplywallst.com. This article by Simply Wall St is general in nature. It does not constitute a recommendation to buy or sell any stock, and does not take account of your objectives, or your financial situation. Simply Wall St has no position in the stocks mentioned.
We aim to bring you long-term focused research analysis driven by fundamental data. Note that our analysis may not factor in the latest price-sensitive company announcements or qualitative material. Thank you for reading.
