
 Yahoo Finance
 A Sliding Share Price Has Us Looking At TE Connectivity Ltd.'s (NYSE:TEL) P/E Ratio

To the annoyance of some shareholders, TE Connectivity (NYSE:TEL) shares are down a considerable 35% in the last month. Even longer term holders have taken a real hit with the stock declining 27% in the last year.
Assuming nothing else has changed, a lower share price makes a stock more attractive to potential buyers. In the long term, share prices tend to follow earnings per share, but in the short term prices bounce around in response to short term factors (which are not always obvious). So, on certain occasions, long term focussed investors try to take advantage of pessimistic expectations to buy shares at a better price. One way to gauge market expectations of a stock is to look at its Price to Earnings Ratio (PE Ratio). A high P/E ratio means that investors have a high expectation about future growth, while a low P/E ratio means they have low expectations about future growth.
View our latest analysis for TE Connectivity
Does TE Connectivity Have A Relatively High Or Low P/E For Its Industry?
TE Connectivity has a P/E ratio of 12.92. As you can see below TE Connectivity has a P/E ratio that is fairly close for the average for the electronic industry, which is 12.7.
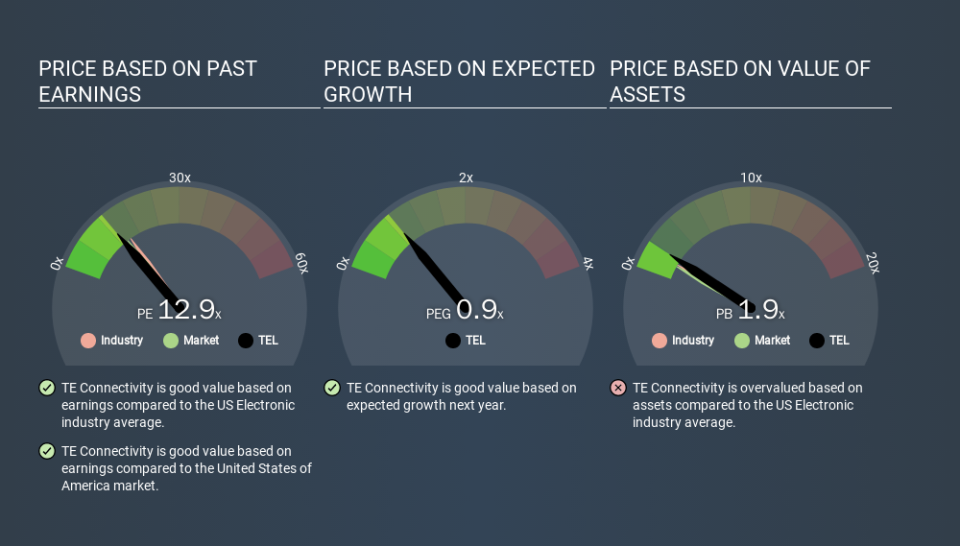
Its P/E ratio suggests that TE Connectivity shareholders think that in the future it will perform about the same as other companies in its industry classification. So if TE Connectivity actually outperforms its peers going forward, that should be a positive for the share price. Further research into factors such as insider buying and selling, could help you form your own view on whether that is likely.
How Growth Rates Impact P/E Ratios
When earnings fall, the 'E' decreases, over time. That means even if the current P/E is low, it will increase over time if the share price stays flat. Then, a higher P/E might scare off shareholders, pushing the share price down.
TE Connectivity's earnings per share fell by 45% in the last twelve months. But EPS is up 2.1% over the last 5 years. And over the longer term (3 years) earnings per share have decreased 5.8% annually. This might lead to low expectations.
Remember: P/E Ratios Don't Consider The Balance Sheet
One drawback of using a P/E ratio is that it considers market capitalization, but not the balance sheet. That means it doesn't take debt or cash into account. In theory, a company can lower its future P/E ratio by using cash or debt to invest in growth.
While growth expenditure doesn't always pay off, the point is that it is a good option to have; but one that the P/E ratio ignores.
So What Does TE Connectivity's Balance Sheet Tell Us?
TE Connectivity has net debt worth 16% of its market capitalization. It would probably deserve a higher P/E ratio if it was net cash, since it would have more options for growth.
The Verdict On TE Connectivity's P/E Ratio
TE Connectivity's P/E is 12.9 which is about average (12.7) in the US market. Given it has some debt, but didn't grow last year, the P/E indicates the market is expecting higher profits ahead for the business. Given TE Connectivity's P/E ratio has declined from 19.8 to 12.9 in the last month, we know for sure that the market is significantly less confident about the business today, than it was back then. For those who prefer to invest with the flow of momentum, that might be a bad sign, but for a contrarian, it may signal opportunity.
When the market is wrong about a stock, it gives savvy investors an opportunity. If the reality for a company is better than it expects, you can make money by buying and holding for the long term. So this free report on the analyst consensus forecasts could help you make a master move on this stock.
You might be able to find a better buy than TE Connectivity. If you want a selection of possible winners, check out this free list of interesting companies that trade on a P/E below 20 (but have proven they can grow earnings).
If you spot an error that warrants correction, please contact the editor at editorial-team@simplywallst.com. This article by Simply Wall St is general in nature. It does not constitute a recommendation to buy or sell any stock, and does not take account of your objectives, or your financial situation. Simply Wall St has no position in the stocks mentioned.
We aim to bring you long-term focused research analysis driven by fundamental data. Note that our analysis may not factor in the latest price-sensitive company announcements or qualitative material. Thank you for reading.
