
 Yahoo Finance
 A Sliding Share Price Has Us Looking At Public Service Enterprise Group Incorporated's (NYSE:PEG) P/E Ratio

To the annoyance of some shareholders, Public Service Enterprise Group (NYSE:PEG) shares are down a considerable 35% in the last month. That drop has capped off a tough year for shareholders, with the share price down 36% in that time.
All else being equal, a share price drop should make a stock more attractive to potential investors. In the long term, share prices tend to follow earnings per share, but in the short term prices bounce around in response to short term factors (which are not always obvious). So, on certain occasions, long term focussed investors try to take advantage of pessimistic expectations to buy shares at a better price. One way to gauge market expectations of a stock is to look at its Price to Earnings Ratio (PE Ratio). A high P/E implies that investors have high expectations of what a company can achieve compared to a company with a low P/E ratio.
View our latest analysis for Public Service Enterprise Group
How Does Public Service Enterprise Group's P/E Ratio Compare To Its Peers?
We can tell from its P/E ratio of 11.39 that sentiment around Public Service Enterprise Group isn't particularly high. We can see in the image below that the average P/E (17.2) for companies in the integrated utilities industry is higher than Public Service Enterprise Group's P/E.
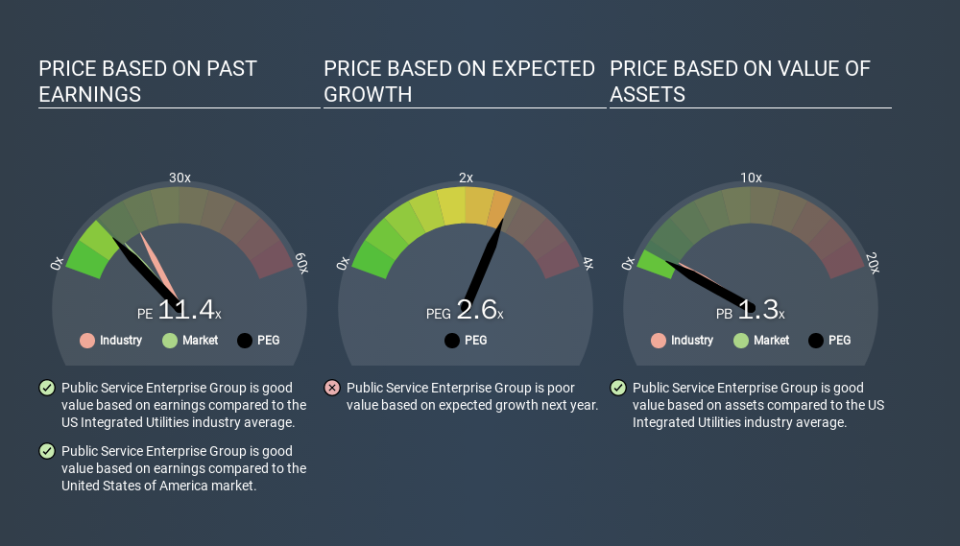
Public Service Enterprise Group's P/E tells us that market participants think it will not fare as well as its peers in the same industry. Since the market seems unimpressed with Public Service Enterprise Group, it's quite possible it could surprise on the upside. If you consider the stock interesting, further research is recommended. For example, I often monitor director buying and selling.
How Growth Rates Impact P/E Ratios
Earnings growth rates have a big influence on P/E ratios. When earnings grow, the 'E' increases, over time. Therefore, even if you pay a high multiple of earnings now, that multiple will become lower in the future. So while a stock may look expensive based on past earnings, it could be cheap based on future earnings.
It's great to see that Public Service Enterprise Group grew EPS by 18% in the last year. And earnings per share have improved by 2.3% annually, over the last five years. This could arguably justify a relatively high P/E ratio.
Remember: P/E Ratios Don't Consider The Balance Sheet
The 'Price' in P/E reflects the market capitalization of the company. Thus, the metric does not reflect cash or debt held by the company. In theory, a company can lower its future P/E ratio by using cash or debt to invest in growth.
Spending on growth might be good or bad a few years later, but the point is that the P/E ratio does not account for the option (or lack thereof).
Is Debt Impacting Public Service Enterprise Group's P/E?
Public Service Enterprise Group's net debt is 83% of its market cap. This is a reasonably significant level of debt -- all else being equal you'd expect a much lower P/E than if it had net cash.
The Bottom Line On Public Service Enterprise Group's P/E Ratio
Public Service Enterprise Group has a P/E of 11.4. That's around the same as the average in the US market, which is 11.8. While it does have meaningful debt levels, it has also produced strong earnings growth recently. However, the P/E ratio implies that most doubt the strong growth will continue. Given Public Service Enterprise Group's P/E ratio has declined from 17.6 to 11.4 in the last month, we know for sure that the market is significantly less confident about the business today, than it was back then. For those who don't like to trade against momentum, that could be a warning sign, but a contrarian investor might want to take a closer look.
Investors have an opportunity when market expectations about a stock are wrong. If it is underestimating a company, investors can make money by buying and holding the shares until the market corrects itself. So this free report on the analyst consensus forecasts could help you make a master move on this stock.
But note: Public Service Enterprise Group may not be the best stock to buy. So take a peek at this free list of interesting companies with strong recent earnings growth (and a P/E ratio below 20).
If you spot an error that warrants correction, please contact the editor at editorial-team@simplywallst.com. This article by Simply Wall St is general in nature. It does not constitute a recommendation to buy or sell any stock, and does not take account of your objectives, or your financial situation. Simply Wall St has no position in the stocks mentioned.
We aim to bring you long-term focused research analysis driven by fundamental data. Note that our analysis may not factor in the latest price-sensitive company announcements or qualitative material. Thank you for reading.
