
 Yahoo Finance
 A Sliding Share Price Has Us Looking At Kendrion N.V.'s (AMS:KENDR) P/E Ratio

Unfortunately for some shareholders, the Kendrion (AMS:KENDR) share price has dived 37% in the last thirty days. That drop has capped off a tough year for shareholders, with the share price down 39% in that time.
All else being equal, a share price drop should make a stock more attractive to potential investors. In the long term, share prices tend to follow earnings per share, but in the short term prices bounce around in response to short term factors (which are not always obvious). So, on certain occasions, long term focussed investors try to take advantage of pessimistic expectations to buy shares at a better price. One way to gauge market expectations of a stock is to look at its Price to Earnings Ratio (PE Ratio). Investors have optimistic expectations of companies with higher P/E ratios, compared to companies with lower P/E ratios.
Check out our latest analysis for Kendrion
Does Kendrion Have A Relatively High Or Low P/E For Its Industry?
Kendrion's P/E of 21.75 indicates some degree of optimism towards the stock. You can see in the image below that the average P/E (16.7) for companies in the electrical industry is lower than Kendrion's P/E.
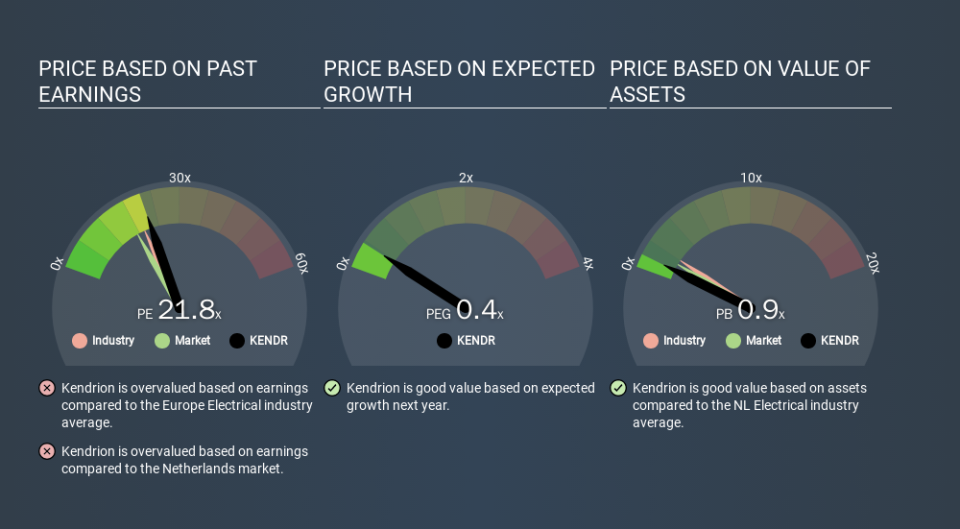
Its relatively high P/E ratio indicates that Kendrion shareholders think it will perform better than other companies in its industry classification. Clearly the market expects growth, but it isn't guaranteed. So investors should delve deeper. I like to check if company insiders have been buying or selling.
How Growth Rates Impact P/E Ratios
Companies that shrink earnings per share quickly will rapidly decrease the 'E' in the equation. That means even if the current P/E is low, it will increase over time if the share price stays flat. So while a stock may look cheap based on past earnings, it could be expensive based on future earnings.
Kendrion's earnings per share fell by 43% in the last twelve months. And over the longer term (5 years) earnings per share have decreased 18% annually. This might lead to muted expectations.
A Limitation: P/E Ratios Ignore Debt and Cash In The Bank
It's important to note that the P/E ratio considers the market capitalization, not the enterprise value. So it won't reflect the advantage of cash, or disadvantage of debt. The exact same company would hypothetically deserve a higher P/E ratio if it had a strong balance sheet, than if it had a weak one with lots of debt, because a cashed up company can spend on growth.
Spending on growth might be good or bad a few years later, but the point is that the P/E ratio does not account for the option (or lack thereof).
Is Debt Impacting Kendrion's P/E?
Kendrion's net debt is 17% of its market cap. This could bring some additional risk, and reduce the number of investment options for management; worth remembering if you compare its P/E to businesses without debt.
The Bottom Line On Kendrion's P/E Ratio
Kendrion has a P/E of 21.8. That's higher than the average in its market, which is 15.4. With modest debt but no EPS growth in the last year, it's fair to say the P/E implies some optimism about future earnings, from the market. What can be absolutely certain is that the market has become significantly less optimistic about Kendrion over the last month, with the P/E ratio falling from 34.6 back then to 21.8 today. For those who prefer to invest with the flow of momentum, that might be a bad sign, but for a contrarian, it may signal opportunity.
When the market is wrong about a stock, it gives savvy investors an opportunity. People often underestimate remarkable growth -- so investors can make money when fast growth is not fully appreciated. So this free visual report on analyst forecasts could hold the key to an excellent investment decision.
Of course, you might find a fantastic investment by looking at a few good candidates. So take a peek at this free list of companies with modest (or no) debt, trading on a P/E below 20.
If you spot an error that warrants correction, please contact the editor at editorial-team@simplywallst.com. This article by Simply Wall St is general in nature. It does not constitute a recommendation to buy or sell any stock, and does not take account of your objectives, or your financial situation. Simply Wall St has no position in the stocks mentioned.
We aim to bring you long-term focused research analysis driven by fundamental data. Note that our analysis may not factor in the latest price-sensitive company announcements or qualitative material. Thank you for reading.
