
 Yahoo Finance
 Slate Grocery REIT (TSE:SGR.UN) shareholders have earned a 14% CAGR over the last five years
These days it's easy to simply buy an index fund, and your returns should (roughly) match the market. But you can do a lot better than that by buying good quality businesses for attractive prices. For example, the Slate Grocery REIT (TSE:SGR.UN) share price is 23% higher than it was five years ago, which is more than the market average. The 4.3% share price rise over the last year is decent, but not great.
With that in mind, it's worth seeing if the company's underlying fundamentals have been the driver of long term performance, or if there are some discrepancies.
View our latest analysis for Slate Grocery REIT
While the efficient markets hypothesis continues to be taught by some, it has been proven that markets are over-reactive dynamic systems, and investors are not always rational. By comparing earnings per share (EPS) and share price changes over time, we can get a feel for how investor attitudes to a company have morphed over time.
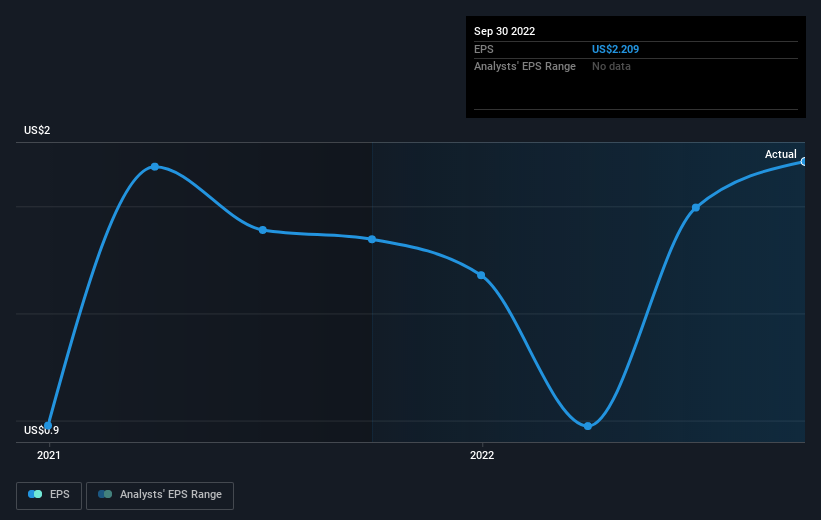
Over half a decade, Slate Grocery REIT managed to grow its earnings per share at 95% a year. The EPS growth is more impressive than the yearly share price gain of 4% over the same period. So one could conclude that the broader market has become more cautious towards the stock. This cautious sentiment is reflected in its (fairly low) P/E ratio of 5.22.
The image below shows how EPS has tracked over time (if you click on the image you can see greater detail).
We know that Slate Grocery REIT has improved its bottom line over the last three years, but what does the future have in store? It might be well worthwhile taking a look at our free report on how its financial position has changed over time.
What About Dividends?
When looking at investment returns, it is important to consider the difference between total shareholder return (TSR) and share price return. Whereas the share price return only reflects the change in the share price, the TSR includes the value of dividends (assuming they were reinvested) and the benefit of any discounted capital raising or spin-off. So for companies that pay a generous dividend, the TSR is often a lot higher than the share price return. We note that for Slate Grocery REIT the TSR over the last 5 years was 94%, which is better than the share price return mentioned above. The dividends paid by the company have thusly boosted the total shareholder return.
A Different Perspective
We're pleased to report that Slate Grocery REIT shareholders have received a total shareholder return of 13% over one year. Of course, that includes the dividend. However, that falls short of the 14% TSR per annum it has made for shareholders, each year, over five years. It's always interesting to track share price performance over the longer term. But to understand Slate Grocery REIT better, we need to consider many other factors. Even so, be aware that Slate Grocery REIT is showing 4 warning signs in our investment analysis , and 1 of those is potentially serious...
We will like Slate Grocery REIT better if we see some big insider buys. While we wait, check out this free list of growing companies with considerable, recent, insider buying.
Please note, the market returns quoted in this article reflect the market weighted average returns of stocks that currently trade on CA exchanges.
Have feedback on this article? Concerned about the content? Get in touch with us directly. Alternatively, email editorial-team (at) simplywallst.com.
This article by Simply Wall St is general in nature. We provide commentary based on historical data and analyst forecasts only using an unbiased methodology and our articles are not intended to be financial advice. It does not constitute a recommendation to buy or sell any stock, and does not take account of your objectives, or your financial situation. We aim to bring you long-term focused analysis driven by fundamental data. Note that our analysis may not factor in the latest price-sensitive company announcements or qualitative material. Simply Wall St has no position in any stocks mentioned.
Join A Paid User Research Session
You’ll receive a US$30 Amazon Gift card for 1 hour of your time while helping us build better investing tools for the individual investors like yourself. Sign up here
