
 Yahoo Finance
 SIMEC Atlantis Energy Limited's (LON:SAE) Business And Shares Still Trailing The Industry
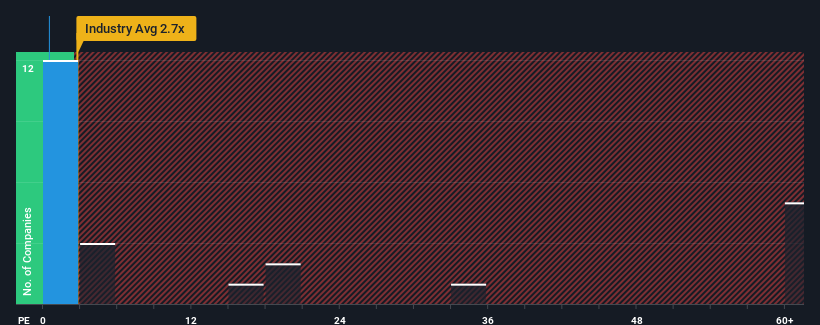
With a price-to-sales (or "P/S") ratio of 0.5x SIMEC Atlantis Energy Limited (LON:SAE) may be sending very bullish signals at the moment, given that almost half of all the Electrical companies in the United Kingdom have P/S ratios greater than 2.7x and even P/S higher than 20x are not unusual. Nonetheless, we'd need to dig a little deeper to determine if there is a rational basis for the highly reduced P/S.
View our latest analysis for SIMEC Atlantis Energy
What Does SIMEC Atlantis Energy's P/S Mean For Shareholders?
Recent times have been quite advantageous for SIMEC Atlantis Energy as its revenue has been rising very briskly. Perhaps the market is expecting future revenue performance to dwindle, which has kept the P/S suppressed. Those who are bullish on SIMEC Atlantis Energy will be hoping that this isn't the case, so that they can pick up the stock at a lower valuation.
We don't have analyst forecasts, but you can see how recent trends are setting up the company for the future by checking out our free report on SIMEC Atlantis Energy's earnings, revenue and cash flow.
Do Revenue Forecasts Match The Low P/S Ratio?
In order to justify its P/S ratio, SIMEC Atlantis Energy would need to produce anemic growth that's substantially trailing the industry.
If we review the last year of revenue growth, the company posted a terrific increase of 208%. The latest three year period has also seen an excellent 36% overall rise in revenue, aided by its short-term performance. Accordingly, shareholders would have definitely welcomed those medium-term rates of revenue growth.
Comparing the recent medium-term revenue trends against the industry's one-year growth forecast of 88% shows it's noticeably less attractive.
In light of this, it's understandable that SIMEC Atlantis Energy's P/S sits below the majority of other companies. It seems most investors are expecting to see the recent limited growth rates continue into the future and are only willing to pay a reduced amount for the stock.
What Does SIMEC Atlantis Energy's P/S Mean For Investors?
It's argued the price-to-sales ratio is an inferior measure of value within certain industries, but it can be a powerful business sentiment indicator.
In line with expectations, SIMEC Atlantis Energy maintains its low P/S on the weakness of its recent three-year growth being lower than the wider industry forecast. At this stage investors feel the potential for an improvement in revenue isn't great enough to justify a higher P/S ratio. If recent medium-term revenue trends continue, it's hard to see the share price experience a reversal of fortunes anytime soon.
It's always necessary to consider the ever-present spectre of investment risk. We've identified 4 warning signs with SIMEC Atlantis Energy (at least 3 which make us uncomfortable), and understanding them should be part of your investment process.
If these risks are making you reconsider your opinion on SIMEC Atlantis Energy, explore our interactive list of high quality stocks to get an idea of what else is out there.
Have feedback on this article? Concerned about the content? Get in touch with us directly. Alternatively, email editorial-team (at) simplywallst.com.
This article by Simply Wall St is general in nature. We provide commentary based on historical data and analyst forecasts only using an unbiased methodology and our articles are not intended to be financial advice. It does not constitute a recommendation to buy or sell any stock, and does not take account of your objectives, or your financial situation. We aim to bring you long-term focused analysis driven by fundamental data. Note that our analysis may not factor in the latest price-sensitive company announcements or qualitative material. Simply Wall St has no position in any stocks mentioned.
