
 Yahoo Finance
 Silvercrest Asset Management Group (NASDAQ:SAMG) shareholders have earned a 14% CAGR over the last five years
If you buy and hold a stock for many years, you'd hope to be making a profit. Furthermore, you'd generally like to see the share price rise faster than the market. Unfortunately for shareholders, while the Silvercrest Asset Management Group Inc. (NASDAQ:SAMG) share price is up 56% in the last five years, that's less than the market return. But if you include dividends then the return is market-beating. On a brighter note, more newer shareholders are probably rather content with the 45% share price gain over twelve months.
Let's take a look at the underlying fundamentals over the longer term, and see if they've been consistent with shareholders returns.
Check out our latest analysis for Silvercrest Asset Management Group
While markets are a powerful pricing mechanism, share prices reflect investor sentiment, not just underlying business performance. One imperfect but simple way to consider how the market perception of a company has shifted is to compare the change in the earnings per share (EPS) with the share price movement.
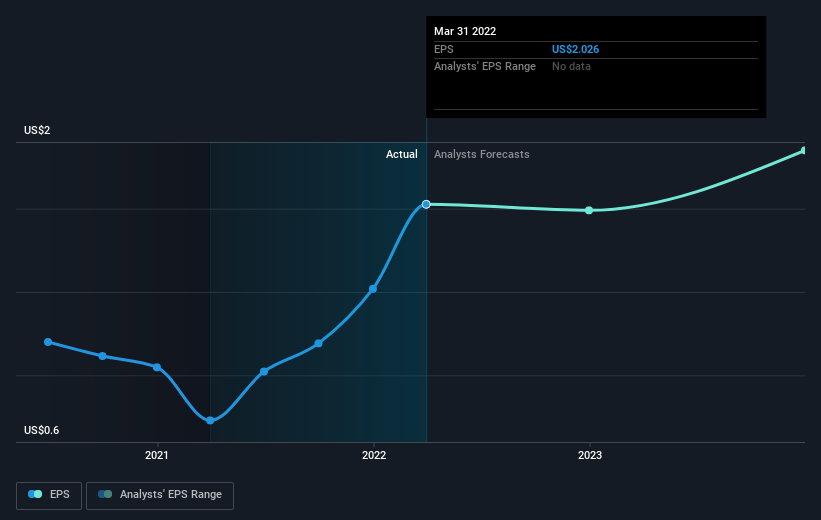
During five years of share price growth, Silvercrest Asset Management Group achieved compound earnings per share (EPS) growth of 15% per year. This EPS growth is higher than the 9% average annual increase in the share price. Therefore, it seems the market has become relatively pessimistic about the company.
The image below shows how EPS has tracked over time (if you click on the image you can see greater detail).
We know that Silvercrest Asset Management Group has improved its bottom line lately, but is it going to grow revenue? Check if analysts think Silvercrest Asset Management Group will grow revenue in the future.
What About Dividends?
As well as measuring the share price return, investors should also consider the total shareholder return (TSR). The TSR is a return calculation that accounts for the value of cash dividends (assuming that any dividend received was reinvested) and the calculated value of any discounted capital raisings and spin-offs. Arguably, the TSR gives a more comprehensive picture of the return generated by a stock. As it happens, Silvercrest Asset Management Group's TSR for the last 5 years was 93%, which exceeds the share price return mentioned earlier. The dividends paid by the company have thusly boosted the total shareholder return.
A Different Perspective
It's nice to see that Silvercrest Asset Management Group shareholders have received a total shareholder return of 51% over the last year. That's including the dividend. That's better than the annualised return of 14% over half a decade, implying that the company is doing better recently. Someone with an optimistic perspective could view the recent improvement in TSR as indicating that the business itself is getting better with time. It's always interesting to track share price performance over the longer term. But to understand Silvercrest Asset Management Group better, we need to consider many other factors. For instance, we've identified 1 warning sign for Silvercrest Asset Management Group that you should be aware of.
Of course, you might find a fantastic investment by looking elsewhere. So take a peek at this free list of companies we expect will grow earnings.
Please note, the market returns quoted in this article reflect the market weighted average returns of stocks that currently trade on US exchanges.
Have feedback on this article? Concerned about the content? Get in touch with us directly. Alternatively, email editorial-team (at) simplywallst.com.
This article by Simply Wall St is general in nature. We provide commentary based on historical data and analyst forecasts only using an unbiased methodology and our articles are not intended to be financial advice. It does not constitute a recommendation to buy or sell any stock, and does not take account of your objectives, or your financial situation. We aim to bring you long-term focused analysis driven by fundamental data. Note that our analysis may not factor in the latest price-sensitive company announcements or qualitative material. Simply Wall St has no position in any stocks mentioned.
