
 Yahoo Finance
 Signet (SIG) Q1 Earnings Surpass Estimates, Sales Dip Y/Y
Signet Jewelers Limited SIG posted first-quarter fiscal 2025 results, wherein both the top and bottom lines beat the Zacks Consensus Estimate. However, both revenues and earnings declined year over year. Also, same-store sales fell 8.9% from the year-ago period.
This Zacks Rank #4 (Sell) player’s shares have lost 7.8% in the past three months compared with the industry’s 7.3% decline.
Signet Jewelers Limited Price, Consensus and EPS Surprise
Signet Jewelers Limited price-consensus-eps-surprise-chart | Signet Jewelers Limited Quote
Quarterly Details
Signet has reported adjusted earnings of $1.11 per share, beating the Zacks Consensus Estimate of 82 cents. The bottom line decreased 37.6% from $1.78 in the year-ago quarter.
This jewelry retailer generated total sales of $1,510.8 million, surpassing the consensus estimate of $1,505 million. However, the top line fell 9.4% year over year. The metric declined 9.6% at constant currency.
A Sneak Peek Into Margins
The gross profit in the fiscal first quarter amounted to $572.4 million, down 9.4% from $632 million in the year-ago quarter. We note that the gross margin remained flat year over year to 37.9% in the quarter under review.
The adjusted merchandise margin increased 100 basis points, driven by growth in services and the introduction of new products, including the expansion of lab-grown diamonds in the fashion segment. However, this gain was partially offset by the deleveraging of occupancy costs due to lower sales.
Selling, general and administrative (SG&A) expenses were $515.4 million, down from $530.4 million in the prior-year quarter. Meanwhile, SG&A expenses, as a percentage of sales, stood at 34.1%, which were 230 bps higher year over year. This change was mainly due to fixed cost deleverage on lower revenue.
SIG reported adjusted operating income of $57.8 million, down from $106.5 million in the year-ago quarter. As a rate of sales, the adjusted operating margin decreased 260 basis points to 3.8%.
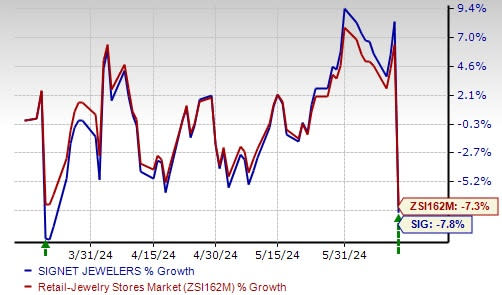
Image Source: Zacks Investment Research
Segmental Discussion
Sales in the North American segment fell 9% year over year to $1.4 billion. This decline was caused by a 1.6% year-over-year dip in the average transaction value (ATV), alongside a reduction in transaction volume. Same-store sales tumbled 9.2% year over year.
Sales in the International segment decreased 17% year over year to $77.2 million due to a 15.3% reduction in ATV, influenced by the sale of prestige watch stores, coupled with fewer transactions. Same-store sales slipped 3.2% year over year. Sales fell 19.5% on a constant-currency basis.
Store Update
Regarding fleet optimization, SIG closed 23 stores this quarter, primarily under the Ernest Jones banner. The company remains on track to open 20 to 30 new stores and renovate approximately 300 existing stores in fiscal 2025.
Financial Details
Signet ended the fiscal first quarter with cash and cash equivalents of $729.3 million and inventories of $1.98 billion. Total shareholders’ equity was $2.08 billion at the end of the fiscal first quarter.
As of May 4, 2024, it used net cash of $158.2 million in operating activities.
During the first quarter, it repurchased approximately 73,000 common shares at an average price of $101.10 per share, totaling $7.4 million.
Guidance
For the second quarter of fiscal 2025, management anticipates total sales in the range of $1.46-$1.52 billion, with same-store sales expected to decline 2-6%. Operating income is forecast to be between $50 million and $75 million, whereas adjusted EBITDA is projected to be between $98 million and $123 million.
For fiscal 2025, Signet expects total sales in the range of $6.66-$7.02 billion, with same-store sales to be between a decline of 4.5% and an increase of 0.5%. Operating income is projected to be between $590 million and $675 million, with an adjusted EBITDA to be between $780 million and $865 million. Earnings per share are anticipated to be between $9.90 and $11.52.
The full-year outlook includes an expected 1.5-2% negative impact on sales due to integration issues with its Digital banners, which are anticipated to be resolved in the second half of fiscal 2025. The company expects about $225 million in sales headwinds from non-comparable events, including over $100 million due to an extra week in fiscal 2024, around $75 million in the United Kingdom from selling high-end watch locations and closing up to 30 Ernest Jones stores, and about $50 million from store closures in North America across fiscal 2024 and 2025.
Despite these challenges, engagement incidents in the United States are expected to increase 5-10% from that reported in fiscal 2024, with the company planning $150-$180 million in cost savings. These savings will be achieved by leveraging technology, such as artificial intelligence, improving sourcing efficiencies and maintaining strict discipline on spending.
Planned capital expenditure is estimated to be between $160 million and $180 million, focusing on store openings, renovations, and digital and technology advancements.
Key Picks
A few better-ranked stocks in the retail space are The Gap, Inc. GPS, Abercrombie & Fitch Co. ANF and Canada Goose GOOS.
Gap is a premier international specialty retailer offering a diverse range of clothing, accessories and personal care products. It currently sports a Zacks Rank #1 (Strong Buy). You can see the complete list of today’s Zacks #1 Rank stocks here.
The Zacks Consensus Estimate for Gap’s fiscal 2024 earnings and sales indicates growth of 17.5% and 0.1%, respectively, from fiscal 2023 reported figures. GPS has a trailing four-quarter average earnings surprise of 202.7%.
Abercrombie is a specialty retailer of premium, high-quality casual apparel. It flaunts a Zacks Rank of 1, at present. ANF delivered a 28.9% earnings surprise in the last reported quarter.
The consensus estimate for Abercrombie’s fiscal 2024 earnings and sales indicates growth of 47.5% and 10.5%, respectively, from the fiscal 2023 levels. ANF has a trailing four-quarter average earnings surprise of 210.3%.
Canada Goose is a global outerwear brand. It sports a Zacks Rank of 1, at present.
The Zacks Consensus Estimate for Canada Goose’s fiscal 2025 earnings indicates growth of 13.7% from the year-ago actuals. GOOS has a trailing four-quarter average earnings surprise of 70.9%.
Want the latest recommendations from Zacks Investment Research? Today, you can download 7 Best Stocks for the Next 30 Days. Click to get this free report
Abercrombie & Fitch Company (ANF) : Free Stock Analysis Report
The Gap, Inc. (GPS) : Free Stock Analysis Report
Signet Jewelers Limited (SIG) : Free Stock Analysis Report
Canada Goose Holdings Inc. (GOOS) : Free Stock Analysis Report
