
 Yahoo Finance
 SigmaTron International (NASDAQ:SGMA) surges 104% this week, taking three-year gains to 457%
For us, stock picking is in large part the hunt for the truly magnificent stocks. Mistakes are inevitable, but a single top stock pick can cover any losses, and so much more. Take, for example, the SigmaTron International, Inc. (NASDAQ:SGMA) share price, which skyrocketed 457% over three years. And in the last week the share price has popped 104%. This could be related to the recent financial results, released less than a week ago -- you can catch up on the most recent data by reading our company report.
The past week has proven to be lucrative for SigmaTron International investors, so let's see if fundamentals drove the company's three-year performance.
See our latest analysis for SigmaTron International
There is no denying that markets are sometimes efficient, but prices do not always reflect underlying business performance. One imperfect but simple way to consider how the market perception of a company has shifted is to compare the change in the earnings per share (EPS) with the share price movement.
SigmaTron International became profitable within the last three years. That kind of transition can be an inflection point that justifies a strong share price gain, just as we have seen here.
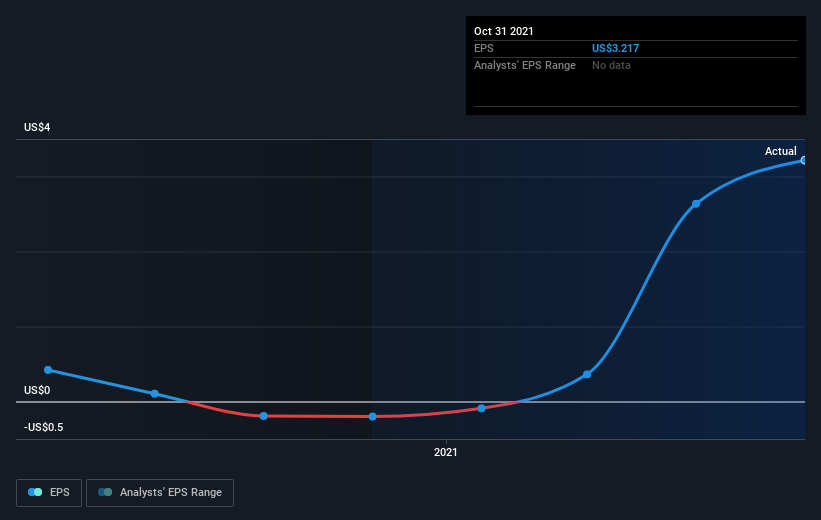
The company's earnings per share (over time) is depicted in the image below (click to see the exact numbers).
We're pleased to report that the CEO is remunerated more modestly than most CEOs at similarly capitalized companies. But while CEO remuneration is always worth checking, the really important question is whether the company can grow earnings going forward. Dive deeper into the earnings by checking this interactive graph of SigmaTron International's earnings, revenue and cash flow.
A Different Perspective
We're pleased to report that SigmaTron International shareholders have received a total shareholder return of 244% over one year. Since the one-year TSR is better than the five-year TSR (the latter coming in at 27% per year), it would seem that the stock's performance has improved in recent times. Someone with an optimistic perspective could view the recent improvement in TSR as indicating that the business itself is getting better with time. I find it very interesting to look at share price over the long term as a proxy for business performance. But to truly gain insight, we need to consider other information, too. To that end, you should be aware of the 4 warning signs we've spotted with SigmaTron International .
If you would prefer to check out another company -- one with potentially superior financials -- then do not miss this free list of companies that have proven they can grow earnings.
Please note, the market returns quoted in this article reflect the market weighted average returns of stocks that currently trade on US exchanges.
Have feedback on this article? Concerned about the content? Get in touch with us directly. Alternatively, email editorial-team (at) simplywallst.com.
This article by Simply Wall St is general in nature. We provide commentary based on historical data and analyst forecasts only using an unbiased methodology and our articles are not intended to be financial advice. It does not constitute a recommendation to buy or sell any stock, and does not take account of your objectives, or your financial situation. We aim to bring you long-term focused analysis driven by fundamental data. Note that our analysis may not factor in the latest price-sensitive company announcements or qualitative material. Simply Wall St has no position in any stocks mentioned.
