
 Yahoo Finance
 Are SigmaTron International Inc’s (NASDAQ:SGMA) Interest Costs Too High?

While small-cap stocks, such as SigmaTron International Inc (NASDAQ:SGMA) with its market cap of US$25.7m, are popular for their explosive growth, investors should also be aware of their balance sheet to judge whether the company can survive a downturn. Companies operating in the Electronic industry, in particular ones that run negative earnings, are inclined towards being higher risk. Evaluating financial health as part of your investment thesis is crucial. Here are a few basic checks that are good enough to have a broad overview of the company’s financial strength. Though, given that I have not delve into the company-specifics, I’d encourage you to dig deeper yourself into SGMA here.
Does SGMA produce enough cash relative to debt?
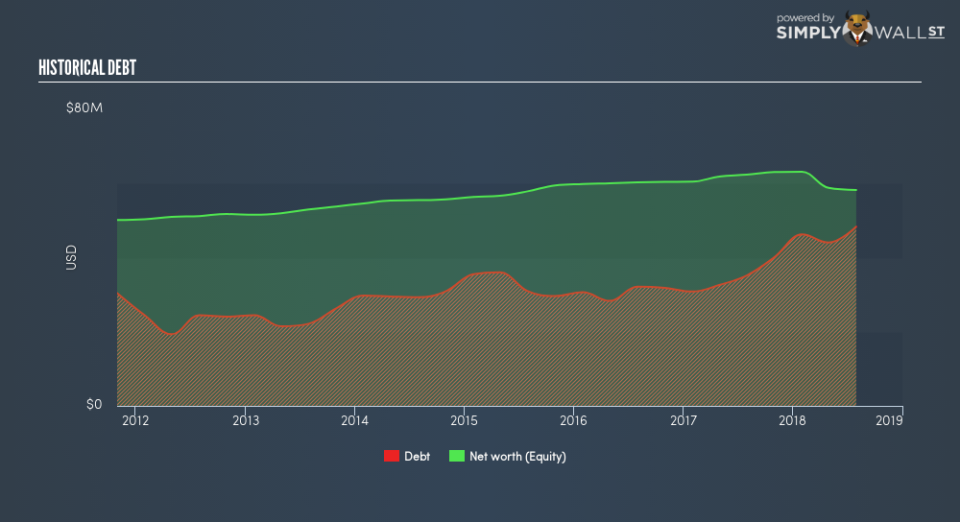
SGMA has built up its total debt levels in the last twelve months, from US$35.2m to US$48.3m , which comprises of short- and long-term debt. With this increase in debt, the current cash and short-term investment levels stands at US$1.8m for investing into the business. Moving onto cash from operations, its operating cash flow is not yet significant enough to calculate a meaningful cash-to-debt ratio, indicating that operational efficiency is something we’d need to take a look at. For this article’s sake, I won’t be looking at this today, but you can examine some of SGMA’s operating efficiency ratios such as ROA here.
Can SGMA pay its short-term liabilities?
With current liabilities at US$60.9m, it appears that the company has been able to meet these commitments with a current assets level of US$125.7m, leading to a 2.07x current account ratio. For Electronic companies, this ratio is within a sensible range since there is a bit of a cash buffer without leaving too much capital in a low-return environment.
Does SGMA face the risk of succumbing to its debt-load?
SGMA is a relatively highly levered company with a debt-to-equity of 82.9%. This is not uncommon for a small-cap company given that debt tends to be lower-cost and at times, more accessible. However, since SGMA is currently unprofitable, sustainability of its current state of operations becomes a concern. Maintaining a high level of debt, while revenues are still below costs, can be dangerous as liquidity tends to dry up in unexpected downturns.
Next Steps:
At its current level of cash flow coverage, SGMA has room for improvement to better cushion for events which may require debt repayment. However, the company will be able to pay all of its upcoming liabilities from its current short-term assets. I admit this is a fairly basic analysis for SGMA’s financial health. Other important fundamentals need to be considered alongside. I suggest you continue to research SigmaTron International to get a better picture of the stock by looking at:
Future Outlook: What are well-informed industry analysts predicting for SGMA’s future growth? Take a look at our free research report of analyst consensus for SGMA’s outlook.
Historical Performance: What has SGMA’s returns been like over the past? Go into more detail in the past track record analysis and take a look at the free visual representations of our analysis for more clarity.
Other High-Performing Stocks: Are there other stocks that provide better prospects with proven track records? Explore our free list of these great stocks here.
To help readers see past the short term volatility of the financial market, we aim to bring you a long-term focused research analysis purely driven by fundamental data. Note that our analysis does not factor in the latest price-sensitive company announcements.
The author is an independent contributor and at the time of publication had no position in the stocks mentioned. For errors that warrant correction please contact the editor at editorial-team@simplywallst.com.
