
 Yahoo Finance
 Do You Like Siemens Healthineers AG (ETR:SHL) At This P/E Ratio?

This article is written for those who want to get better at using price to earnings ratios (P/E ratios). We'll look at Siemens Healthineers AG's (ETR:SHL) P/E ratio and reflect on what it tells us about the company's share price. Looking at earnings over the last twelve months, Siemens Healthineers has a P/E ratio of 27.69. That is equivalent to an earnings yield of about 3.6%.
Check out our latest analysis for Siemens Healthineers
How Do You Calculate Siemens Healthineers's P/E Ratio?
The formula for P/E is:
Price to Earnings Ratio = Share Price ÷ Earnings per Share (EPS)
Or for Siemens Healthineers:
P/E of 27.69 = €43.47 ÷ €1.57 (Based on the year to September 2019.)
Is A High Price-to-Earnings Ratio Good?
A higher P/E ratio means that investors are paying a higher price for each €1 of company earnings. All else being equal, it's better to pay a low price -- but as Warren Buffett said, 'It's far better to buy a wonderful company at a fair price than a fair company at a wonderful price.
Does Siemens Healthineers Have A Relatively High Or Low P/E For Its Industry?
One good way to get a quick read on what market participants expect of a company is to look at its P/E ratio. The image below shows that Siemens Healthineers has a lower P/E than the average (41.8) P/E for companies in the medical equipment industry.
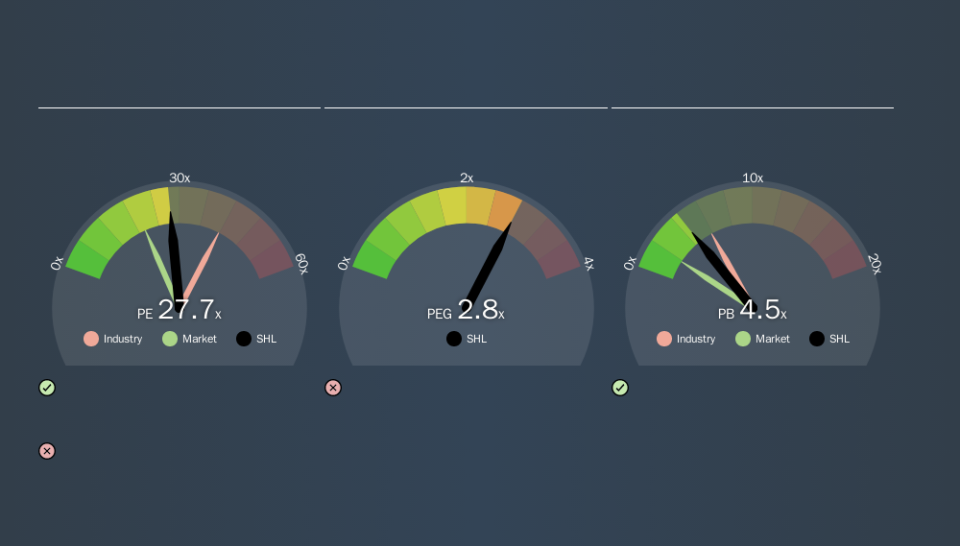
This suggests that market participants think Siemens Healthineers will underperform other companies in its industry. Since the market seems unimpressed with Siemens Healthineers, it's quite possible it could surprise on the upside. You should delve deeper. I like to check if company insiders have been buying or selling.
How Growth Rates Impact P/E Ratios
P/E ratios primarily reflect market expectations around earnings growth rates. That's because companies that grow earnings per share quickly will rapidly increase the 'E' in the equation. And in that case, the P/E ratio itself will drop rather quickly. A lower P/E should indicate the stock is cheap relative to others -- and that may attract buyers.
Most would be impressed by Siemens Healthineers earnings growth of 24% in the last year. And earnings per share have improved by 4.2% annually, over the last five years. This could arguably justify a relatively high P/E ratio.
Don't Forget: The P/E Does Not Account For Debt or Bank Deposits
One drawback of using a P/E ratio is that it considers market capitalization, but not the balance sheet. Thus, the metric does not reflect cash or debt held by the company. The exact same company would hypothetically deserve a higher P/E ratio if it had a strong balance sheet, than if it had a weak one with lots of debt, because a cashed up company can spend on growth.
Such spending might be good or bad, overall, but the key point here is that you need to look at debt to understand the P/E ratio in context.
Is Debt Impacting Siemens Healthineers's P/E?
Siemens Healthineers's net debt is 7.1% of its market cap. It would probably trade on a higher P/E ratio if it had a lot of cash, but I doubt it is having a big impact.
The Verdict On Siemens Healthineers's P/E Ratio
Siemens Healthineers's P/E is 27.7 which is above average (20.1) in its market. Its debt levels do not imperil its balance sheet and it is growing EPS strongly. Therefore, it's not particularly surprising that it has a above average P/E ratio.
When the market is wrong about a stock, it gives savvy investors an opportunity. People often underestimate remarkable growth -- so investors can make money when fast growth is not fully appreciated. So this free visualization of the analyst consensus on future earnings could help you make the right decision about whether to buy, sell, or hold.
Of course you might be able to find a better stock than Siemens Healthineers. So you may wish to see this free collection of other companies that have grown earnings strongly.
If you spot an error that warrants correction, please contact the editor at editorial-team@simplywallst.com. This article by Simply Wall St is general in nature. It does not constitute a recommendation to buy or sell any stock, and does not take account of your objectives, or your financial situation. Simply Wall St has no position in the stocks mentioned.
We aim to bring you long-term focused research analysis driven by fundamental data. Note that our analysis may not factor in the latest price-sensitive company announcements or qualitative material. Thank you for reading.
