
 Yahoo Finance
 Is Shoe Carnival, Inc.'s (NASDAQ:SCVL) P/E Ratio Really That Good?

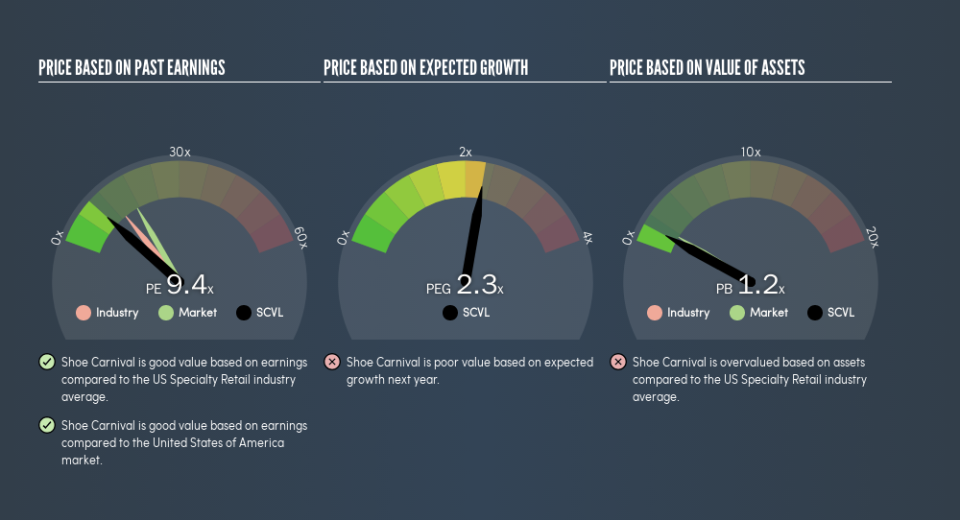
Today, we'll introduce the concept of the P/E ratio for those who are learning about investing. We'll show how you can use Shoe Carnival, Inc.'s (NASDAQ:SCVL) P/E ratio to inform your assessment of the investment opportunity. What is Shoe Carnival's P/E ratio? Well, based on the last twelve months it is 9.41. That means that at current prices, buyers pay $9.41 for every $1 in trailing yearly profits.
See our latest analysis for Shoe Carnival
How Do I Calculate A Price To Earnings Ratio?
The formula for price to earnings is:
Price to Earnings Ratio = Share Price ÷ Earnings per Share (EPS)
Or for Shoe Carnival:
P/E of 9.41 = $24.62 ÷ $2.62 (Based on the trailing twelve months to May 2019.)
Is A High Price-to-Earnings Ratio Good?
The higher the P/E ratio, the higher the price tag of a business, relative to its trailing earnings. All else being equal, it's better to pay a low price -- but as Warren Buffett said, 'It's far better to buy a wonderful company at a fair price than a fair company at a wonderful price.'
Does Shoe Carnival Have A Relatively High Or Low P/E For Its Industry?
The P/E ratio essentially measures market expectations of a company. If you look at the image below, you can see Shoe Carnival has a lower P/E than the average (13.4) in the specialty retail industry classification.
Its relatively low P/E ratio indicates that Shoe Carnival shareholders think it will struggle to do as well as other companies in its industry classification. Many investors like to buy stocks when the market is pessimistic about their prospects. It is arguably worth checking if insiders are buying shares, because that might imply they believe the stock is undervalued.
How Growth Rates Impact P/E Ratios
P/E ratios primarily reflect market expectations around earnings growth rates. If earnings are growing quickly, then the 'E' in the equation will increase faster than it would otherwise. And in that case, the P/E ratio itself will drop rather quickly. And as that P/E ratio drops, the company will look cheap, unless its share price increases.
Shoe Carnival's 78% EPS improvement over the last year was like bamboo growth after rain; rapid and impressive. Even better, EPS is up 21% per year over three years. So we'd absolutely expect it to have a relatively high P/E ratio.
A Limitation: P/E Ratios Ignore Debt and Cash In The Bank
The 'Price' in P/E reflects the market capitalization of the company. In other words, it does not consider any debt or cash that the company may have on the balance sheet. Hypothetically, a company could reduce its future P/E ratio by spending its cash (or taking on debt) to achieve higher earnings.
While growth expenditure doesn't always pay off, the point is that it is a good option to have; but one that the P/E ratio ignores.
Shoe Carnival's Balance Sheet
The extra options and safety that comes with Shoe Carnival's US$22m net cash position means that it deserves a higher P/E than it would if it had a lot of net debt.
The Bottom Line On Shoe Carnival's P/E Ratio
Shoe Carnival has a P/E of 9.4. That's below the average in the US market, which is 17.4. The net cash position gives plenty of options to the business, and the recent improvement in EPS is good to see. The below average P/E ratio suggests that market participants don't believe the strong growth will continue.
Investors have an opportunity when market expectations about a stock are wrong. If it is underestimating a company, investors can make money by buying and holding the shares until the market corrects itself. So this free visual report on analyst forecasts could hold the key to an excellent investment decision.
You might be able to find a better buy than Shoe Carnival. If you want a selection of possible winners, check out this free list of interesting companies that trade on a P/E below 20 (but have proven they can grow earnings).
We aim to bring you long-term focused research analysis driven by fundamental data. Note that our analysis may not factor in the latest price-sensitive company announcements or qualitative material.
If you spot an error that warrants correction, please contact the editor at editorial-team@simplywallst.com. This article by Simply Wall St is general in nature. It does not constitute a recommendation to buy or sell any stock, and does not take account of your objectives, or your financial situation. Simply Wall St has no position in the stocks mentioned. Thank you for reading.
