
 Yahoo Finance
 Shareholders in Zai Lab (NASDAQ:ZLAB) are in the red if they invested three years ago
As an investor, mistakes are inevitable. But really bad investments should be rare. So take a moment to sympathize with the long term shareholders of Zai Lab Limited (NASDAQ:ZLAB), who have seen the share price tank a massive 87% over a three year period. That would certainly shake our confidence in the decision to own the stock. And the ride hasn't got any smoother in recent times over the last year, with the price 53% lower in that time. The falls have accelerated recently, with the share price down 39% in the last three months. We really feel for shareholders in this scenario. It's a good reminder of the importance of diversification, and it's worth keeping in mind there's more to life than money, anyway.
Now let's have a look at the company's fundamentals, and see if the long term shareholder return has matched the performance of the underlying business.
Check out our latest analysis for Zai Lab
Zai Lab isn't currently profitable, so most analysts would look to revenue growth to get an idea of how fast the underlying business is growing. When a company doesn't make profits, we'd generally hope to see good revenue growth. That's because it's hard to be confident a company will be sustainable if revenue growth is negligible, and it never makes a profit.
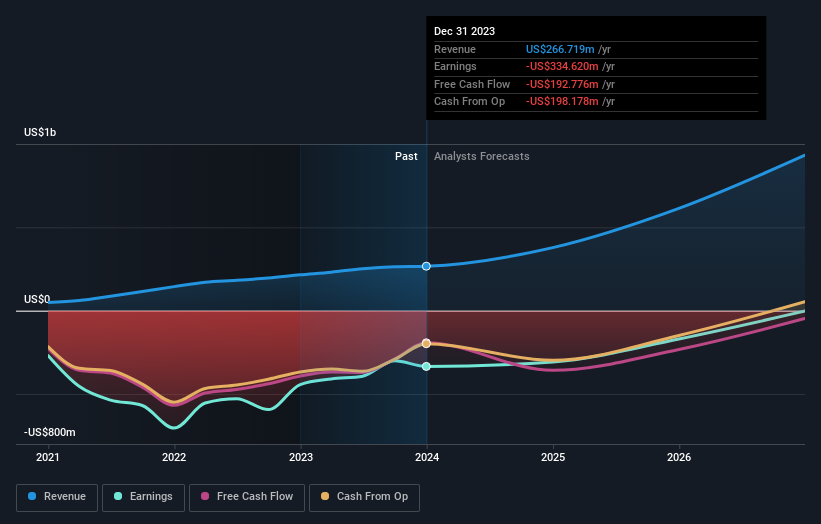
In the last three years, Zai Lab saw its revenue grow by 45% per year, compound. That is faster than most pre-profit companies. So on the face of it we're really surprised to see the share price down 23% a year in the same time period. The share price makes us wonder if there is an issue with profitability. Ultimately, revenue growth doesn't amount to much if the business can't scale well. If the company is low on cash, it may have to raise capital soon.
The image below shows how earnings and revenue have tracked over time (if you click on the image you can see greater detail).
Zai Lab is a well known stock, with plenty of analyst coverage, suggesting some visibility into future growth. Given we have quite a good number of analyst forecasts, it might be well worth checking out this free chart depicting consensus estimates.
A Different Perspective
Zai Lab shareholders are down 53% for the year, but the market itself is up 28%. Even the share prices of good stocks drop sometimes, but we want to see improvements in the fundamental metrics of a business, before getting too interested. Unfortunately, last year's performance may indicate unresolved challenges, given that it was worse than the annualised loss of 8% over the last half decade. Generally speaking long term share price weakness can be a bad sign, though contrarian investors might want to research the stock in hope of a turnaround. I find it very interesting to look at share price over the long term as a proxy for business performance. But to truly gain insight, we need to consider other information, too. Case in point: We've spotted 2 warning signs for Zai Lab you should be aware of.
Of course, you might find a fantastic investment by looking elsewhere. So take a peek at this free list of companies we expect will grow earnings.
Please note, the market returns quoted in this article reflect the market weighted average returns of stocks that currently trade on American exchanges.
Have feedback on this article? Concerned about the content? Get in touch with us directly. Alternatively, email editorial-team (at) simplywallst.com.
This article by Simply Wall St is general in nature. We provide commentary based on historical data and analyst forecasts only using an unbiased methodology and our articles are not intended to be financial advice. It does not constitute a recommendation to buy or sell any stock, and does not take account of your objectives, or your financial situation. We aim to bring you long-term focused analysis driven by fundamental data. Note that our analysis may not factor in the latest price-sensitive company announcements or qualitative material. Simply Wall St has no position in any stocks mentioned.
