
 Yahoo Finance
 Shareholders in TVA Group (TSE:TVA.B) are in the red if they invested five years ago
Statistically speaking, long term investing is a profitable endeavour. But no-one is immune from buying too high. To wit, the TVA Group Inc. (TSE:TVA.B) share price managed to fall 54% over five long years. That's an unpleasant experience for long term holders. We also note that the stock has performed poorly over the last year, with the share price down 53%. The falls have accelerated recently, with the share price down 31% in the last three months.
It's worthwhile assessing if the company's economics have been moving in lockstep with these underwhelming shareholder returns, or if there is some disparity between the two. So let's do just that.
View our latest analysis for TVA Group
Given that TVA Group didn't make a profit in the last twelve months, we'll focus on revenue growth to form a quick view of its business development. Shareholders of unprofitable companies usually expect strong revenue growth. That's because it's hard to be confident a company will be sustainable if revenue growth is negligible, and it never makes a profit.
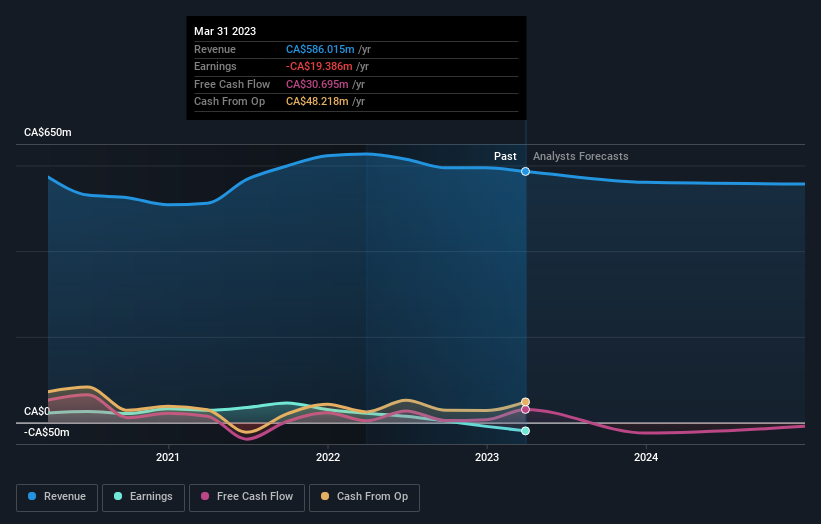
In the last half decade, TVA Group saw its revenue increase by 1.6% per year. That's not a very high growth rate considering it doesn't make profits. It's likely this weak growth has contributed to an annualised return of 9% for the last five years. We want to see an acceleration of revenue growth (or profits) before showing much interest in this one. However, it's possible too many in the market will ignore it, and there may be an opportunity if it starts to recover down the track.
You can see below how earnings and revenue have changed over time (discover the exact values by clicking on the image).
This free interactive report on TVA Group's balance sheet strength is a great place to start, if you want to investigate the stock further.
A Different Perspective
While the broader market lost about 3.5% in the twelve months, TVA Group shareholders did even worse, losing 53%. Having said that, it's inevitable that some stocks will be oversold in a falling market. The key is to keep your eyes on the fundamental developments. Unfortunately, last year's performance may indicate unresolved challenges, given that it was worse than the annualised loss of 9% over the last half decade. We realise that Baron Rothschild has said investors should "buy when there is blood on the streets", but we caution that investors should first be sure they are buying a high quality business. While it is well worth considering the different impacts that market conditions can have on the share price, there are other factors that are even more important. Case in point: We've spotted 1 warning sign for TVA Group you should be aware of.
If you like to buy stocks alongside management, then you might just love this free list of companies. (Hint: insiders have been buying them).
Please note, the market returns quoted in this article reflect the market weighted average returns of stocks that currently trade on Canadian exchanges.
Have feedback on this article? Concerned about the content? Get in touch with us directly. Alternatively, email editorial-team (at) simplywallst.com.
This article by Simply Wall St is general in nature. We provide commentary based on historical data and analyst forecasts only using an unbiased methodology and our articles are not intended to be financial advice. It does not constitute a recommendation to buy or sell any stock, and does not take account of your objectives, or your financial situation. We aim to bring you long-term focused analysis driven by fundamental data. Note that our analysis may not factor in the latest price-sensitive company announcements or qualitative material. Simply Wall St has no position in any stocks mentioned.
Join A Paid User Research Session
You’ll receive a US$30 Amazon Gift card for 1 hour of your time while helping us build better investing tools for the individual investors like yourself. Sign up here
