
 Yahoo Finance
 Shareholders in Scentre Group (ASX:SCG) are in the red if they invested five years ago
In order to justify the effort of selecting individual stocks, it's worth striving to beat the returns from a market index fund. But even the best stock picker will only win with some selections. At this point some shareholders may be questioning their investment in Scentre Group (ASX:SCG), since the last five years saw the share price fall 34%.
So let's have a look and see if the longer term performance of the company has been in line with the underlying business' progress.
View our latest analysis for Scentre Group
There is no denying that markets are sometimes efficient, but prices do not always reflect underlying business performance. One flawed but reasonable way to assess how sentiment around a company has changed is to compare the earnings per share (EPS) with the share price.
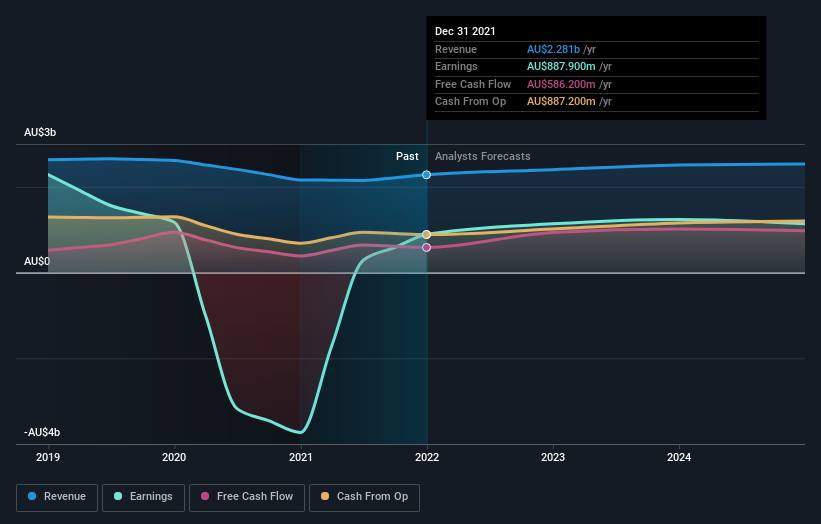
During five years of share price growth, Scentre Group moved from a loss to profitability. That would generally be considered a positive, so we are surprised to see the share price is down. Other metrics might give us a better handle on how its value is changing over time.
We note that the dividend has fallen in the last five years, so that may have contributed to the share price decline. The revenue decline of around 2.8% would not have helped the stock price. So the the weak dividend and revenue data could well help explain the soft share price.
The graphic below depicts how earnings and revenue have changed over time (unveil the exact values by clicking on the image).
We know that Scentre Group has improved its bottom line lately, but what does the future have in store? So we recommend checking out this free report showing consensus forecasts
What About Dividends?
It is important to consider the total shareholder return, as well as the share price return, for any given stock. The TSR is a return calculation that accounts for the value of cash dividends (assuming that any dividend received was reinvested) and the calculated value of any discounted capital raisings and spin-offs. Arguably, the TSR gives a more comprehensive picture of the return generated by a stock. We note that for Scentre Group the TSR over the last 5 years was -16%, which is better than the share price return mentioned above. And there's no prize for guessing that the dividend payments largely explain the divergence!
A Different Perspective
It's nice to see that Scentre Group shareholders have received a total shareholder return of 8.0% over the last year. Of course, that includes the dividend. That certainly beats the loss of about 3% per year over the last half decade. This makes us a little wary, but the business might have turned around its fortunes. While it is well worth considering the different impacts that market conditions can have on the share price, there are other factors that are even more important. Like risks, for instance. Every company has them, and we've spotted 2 warning signs for Scentre Group (of which 1 is a bit concerning!) you should know about.
If you would prefer to check out another company -- one with potentially superior financials -- then do not miss this free list of companies that have proven they can grow earnings.
Please note, the market returns quoted in this article reflect the market weighted average returns of stocks that currently trade on AU exchanges.
Have feedback on this article? Concerned about the content? Get in touch with us directly. Alternatively, email editorial-team (at) simplywallst.com.
This article by Simply Wall St is general in nature. We provide commentary based on historical data and analyst forecasts only using an unbiased methodology and our articles are not intended to be financial advice. It does not constitute a recommendation to buy or sell any stock, and does not take account of your objectives, or your financial situation. We aim to bring you long-term focused analysis driven by fundamental data. Note that our analysis may not factor in the latest price-sensitive company announcements or qualitative material. Simply Wall St has no position in any stocks mentioned.
