
 Yahoo Finance
 Shareholders Of Pennon Group (LON:PNN) Must Be Happy With Their 71% Return
By buying an index fund, you can roughly match the market return with ease. But many of us dare to dream of bigger returns, and build a portfolio ourselves. For example, Pennon Group Plc (LON:PNN) shareholders have seen the share price rise 49% over three years, well in excess of the market decline (0.7%, not including dividends).
View our latest analysis for Pennon Group
In his essay The Superinvestors of Graham-and-Doddsville Warren Buffett described how share prices do not always rationally reflect the value of a business. One flawed but reasonable way to assess how sentiment around a company has changed is to compare the earnings per share (EPS) with the share price.
Over the last three years, Pennon Group failed to grow earnings per share, which fell 24% (annualized).
So we doubt that the market is looking to EPS for its main judge of the company's value. Given this situation, it makes sense to look at other metrics too.
Interestingly, the dividend has increased over time; so that may have given the share price a boost. It could be that the company is reaching maturity and dividend investors are buying for the yield.
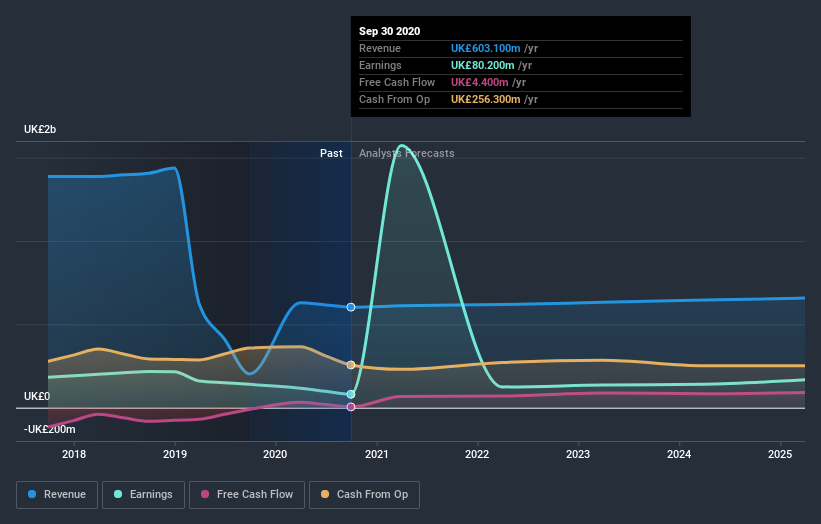
The graphic below depicts how earnings and revenue have changed over time (unveil the exact values by clicking on the image).
Pennon Group is a well known stock, with plenty of analyst coverage, suggesting some visibility into future growth. So it makes a lot of sense to check out what analysts think Pennon Group will earn in the future (free analyst consensus estimates)
What About Dividends?
As well as measuring the share price return, investors should also consider the total shareholder return (TSR). The TSR is a return calculation that accounts for the value of cash dividends (assuming that any dividend received was reinvested) and the calculated value of any discounted capital raisings and spin-offs. It's fair to say that the TSR gives a more complete picture for stocks that pay a dividend. We note that for Pennon Group the TSR over the last 3 years was 71%, which is better than the share price return mentioned above. And there's no prize for guessing that the dividend payments largely explain the divergence!
A Different Perspective
While the broader market gained around 39% in the last year, Pennon Group shareholders lost 2.8% (even including dividends). However, keep in mind that even the best stocks will sometimes underperform the market over a twelve month period. On the bright side, long term shareholders have made money, with a gain of 8% per year over half a decade. It could be that the recent sell-off is an opportunity, so it may be worth checking the fundamental data for signs of a long term growth trend. It's always interesting to track share price performance over the longer term. But to understand Pennon Group better, we need to consider many other factors. Take risks, for example - Pennon Group has 4 warning signs (and 2 which can't be ignored) we think you should know about.
Of course Pennon Group may not be the best stock to buy. So you may wish to see this free collection of growth stocks.
Please note, the market returns quoted in this article reflect the market weighted average returns of stocks that currently trade on GB exchanges.
This article by Simply Wall St is general in nature. It does not constitute a recommendation to buy or sell any stock, and does not take account of your objectives, or your financial situation. We aim to bring you long-term focused analysis driven by fundamental data. Note that our analysis may not factor in the latest price-sensitive company announcements or qualitative material. Simply Wall St has no position in any stocks mentioned.
Have feedback on this article? Concerned about the content? Get in touch with us directly. Alternatively, email editorial-team (at) simplywallst.com.
