
 Yahoo Finance
 Shareholders Of KAR Auction Services (NYSE:KAR) Have Received 14% On Their Investment
KAR Auction Services, Inc. (NYSE:KAR) shareholders should be happy to see the share price up 26% in the last month. But that doesn't help the fact that the three year return is less impressive. After all, the share price is down 60% in the last three years, significantly under-performing the market.
See our latest analysis for KAR Auction Services
There is no denying that markets are sometimes efficient, but prices do not always reflect underlying business performance. One imperfect but simple way to consider how the market perception of a company has shifted is to compare the change in the earnings per share (EPS) with the share price movement.
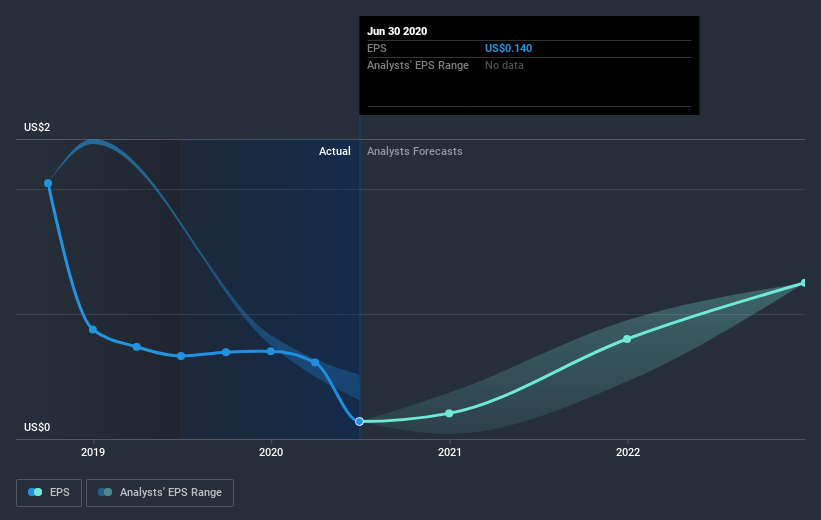
KAR Auction Services saw its EPS decline at a compound rate of 56% per year, over the last three years. This fall in the EPS is worse than the 26% compound annual share price fall. This suggests that the market retains some optimism around long term earnings stability, despite past EPS declines. With a P/E ratio of 128.03, it's fair to say the market sees a brighter future for the business.
The graphic below depicts how EPS has changed over time (unveil the exact values by clicking on the image).
We like that insiders have been buying shares in the last twelve months. Having said that, most people consider earnings and revenue growth trends to be a more meaningful guide to the business. Dive deeper into the earnings by checking this interactive graph of KAR Auction Services' earnings, revenue and cash flow.
What about the Total Shareholder Return (TSR)?
We've already covered KAR Auction Services' share price action, but we should also mention its total shareholder return (TSR). The TSR is a return calculation that accounts for the value of cash dividends (assuming that any dividend received was reinvested) and the calculated value of any discounted capital raisings and spin-offs. KAR Auction Services' TSR of 14% for the 3 years exceeded its share price return, because it has paid dividends.
A Different Perspective
While the broader market gained around 24% in the last year, KAR Auction Services shareholders lost 28%. However, keep in mind that even the best stocks will sometimes underperform the market over a twelve month period. On the bright side, long term shareholders have made money, with a gain of 8.0% per year over half a decade. It could be that the recent sell-off is an opportunity, so it may be worth checking the fundamental data for signs of a long term growth trend. It's always interesting to track share price performance over the longer term. But to understand KAR Auction Services better, we need to consider many other factors. To that end, you should learn about the 4 warning signs we've spotted with KAR Auction Services (including 1 which is is a bit concerning) .
There are plenty of other companies that have insiders buying up shares. You probably do not want to miss this free list of growing companies that insiders are buying.
Please note, the market returns quoted in this article reflect the market weighted average returns of stocks that currently trade on US exchanges.
This article by Simply Wall St is general in nature. It does not constitute a recommendation to buy or sell any stock, and does not take account of your objectives, or your financial situation. We aim to bring you long-term focused analysis driven by fundamental data. Note that our analysis may not factor in the latest price-sensitive company announcements or qualitative material. Simply Wall St has no position in any stocks mentioned.
Have feedback on this article? Concerned about the content? Get in touch with us directly. Alternatively, email editorial-team@simplywallst.com.
