
 Yahoo Finance
 Shareholders in Ituran Location and Control (NASDAQ:ITRN) are in the red if they invested five years ago
The main aim of stock picking is to find the market-beating stocks. But the main game is to find enough winners to more than offset the losers At this point some shareholders may be questioning their investment in Ituran Location and Control Ltd. (NASDAQ:ITRN), since the last five years saw the share price fall 28%. Even worse, it's down 9.2% in about a month, which isn't fun at all. This could be related to the recent financial results - you can catch up on the most recent data by reading our company report.
With that in mind, it's worth seeing if the company's underlying fundamentals have been the driver of long term performance, or if there are some discrepancies.
View our latest analysis for Ituran Location and Control
While markets are a powerful pricing mechanism, share prices reflect investor sentiment, not just underlying business performance. One way to examine how market sentiment has changed over time is to look at the interaction between a company's share price and its earnings per share (EPS).
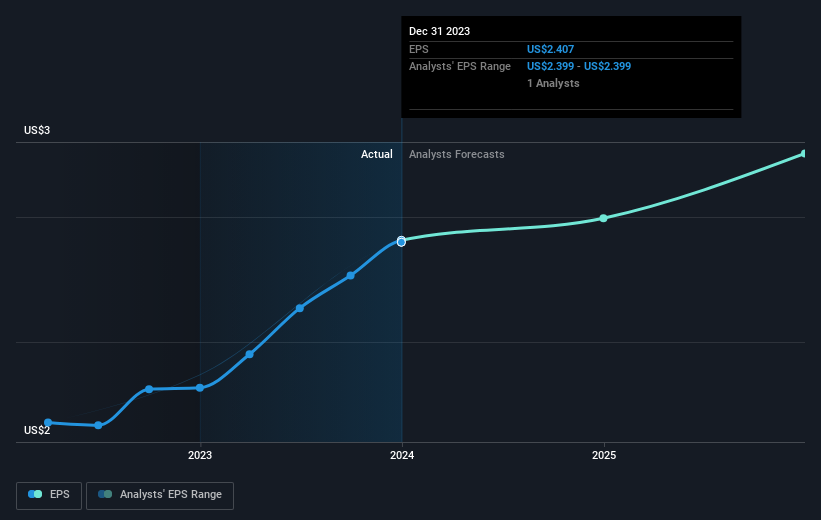
Looking back five years, both Ituran Location and Control's share price and EPS declined; the latter at a rate of 3.4% per year. This reduction in EPS is less than the 6% annual reduction in the share price. So it seems the market was too confident about the business, in the past. The low P/E ratio of 10.72 further reflects this reticence.
The company's earnings per share (over time) is depicted in the image below (click to see the exact numbers).
Before buying or selling a stock, we always recommend a close examination of historic growth trends, available here.
What About Dividends?
As well as measuring the share price return, investors should also consider the total shareholder return (TSR). The TSR is a return calculation that accounts for the value of cash dividends (assuming that any dividend received was reinvested) and the calculated value of any discounted capital raisings and spin-offs. Arguably, the TSR gives a more comprehensive picture of the return generated by a stock. As it happens, Ituran Location and Control's TSR for the last 5 years was -17%, which exceeds the share price return mentioned earlier. The dividends paid by the company have thusly boosted the total shareholder return.
A Different Perspective
Ituran Location and Control provided a TSR of 28% over the year (including dividends). That's fairly close to the broader market return. To take a positive view, the gain is pleasing, and it sure beats annualized TSR loss of 3%, which was endured over half a decade. We're pretty skeptical of turnaround stories, but it's good to see the recent share price recovery. It's always interesting to track share price performance over the longer term. But to understand Ituran Location and Control better, we need to consider many other factors. Even so, be aware that Ituran Location and Control is showing 1 warning sign in our investment analysis , you should know about...
If you like to buy stocks alongside management, then you might just love this free list of companies. (Hint: insiders have been buying them).
Please note, the market returns quoted in this article reflect the market weighted average returns of stocks that currently trade on American exchanges.
Have feedback on this article? Concerned about the content? Get in touch with us directly. Alternatively, email editorial-team (at) simplywallst.com.
This article by Simply Wall St is general in nature. We provide commentary based on historical data and analyst forecasts only using an unbiased methodology and our articles are not intended to be financial advice. It does not constitute a recommendation to buy or sell any stock, and does not take account of your objectives, or your financial situation. We aim to bring you long-term focused analysis driven by fundamental data. Note that our analysis may not factor in the latest price-sensitive company announcements or qualitative material. Simply Wall St has no position in any stocks mentioned.
