
 Yahoo Finance
 Shareholders in Graham (NYSE:GHM) are in the red if they invested five years ago
We think intelligent long term investing is the way to go. But unfortunately, some companies simply don't succeed. To wit, the Graham Corporation (NYSE:GHM) share price managed to fall 56% over five long years. We certainly feel for shareholders who bought near the top. Shareholders have had an even rougher run lately, with the share price down 22% in the last 90 days.
With that in mind, it's worth seeing if the company's underlying fundamentals have been the driver of long term performance, or if there are some discrepancies.
See our latest analysis for Graham
Graham isn't currently profitable, so most analysts would look to revenue growth to get an idea of how fast the underlying business is growing. Shareholders of unprofitable companies usually expect strong revenue growth. Some companies are willing to postpone profitability to grow revenue faster, but in that case one does expect good top-line growth.
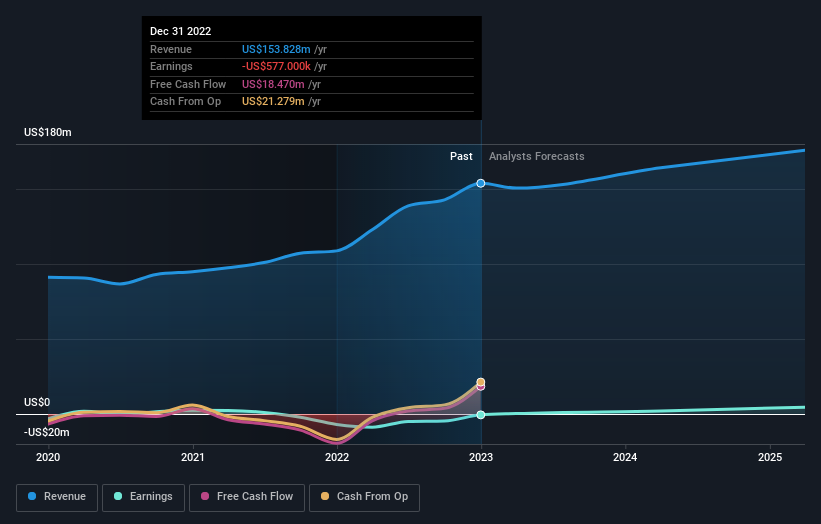
In the last half decade, Graham saw its revenue increase by 12% per year. That's a pretty good rate for a long time period. The share price, meanwhile, has fallen 9% compounded, over five years. That suggests the market is disappointed with the current growth rate. A pessimistic market can create opportunities.
The image below shows how earnings and revenue have tracked over time (if you click on the image you can see greater detail).
We like that insiders have been buying shares in the last twelve months. Having said that, most people consider earnings and revenue growth trends to be a more meaningful guide to the business. This free report showing analyst forecasts should help you form a view on Graham
What About The Total Shareholder Return (TSR)?
We'd be remiss not to mention the difference between Graham's total shareholder return (TSR) and its share price return. Arguably the TSR is a more complete return calculation because it accounts for the value of dividends (as if they were reinvested), along with the hypothetical value of any discounted capital that have been offered to shareholders. Dividends have been really beneficial for Graham shareholders, and that cash payout explains why its total shareholder loss of 51%, over the last 5 years, isn't as bad as the share price return.
A Different Perspective
We're pleased to report that Graham shareholders have received a total shareholder return of 46% over one year. That certainly beats the loss of about 9% per year over the last half decade. This makes us a little wary, but the business might have turned around its fortunes. If you want to research this stock further, the data on insider buying is an obvious place to start. You can click here to see who has been buying shares - and the price they paid.
Graham is not the only stock that insiders are buying. For those who like to find winning investments this free list of growing companies with recent insider purchasing, could be just the ticket.
Please note, the market returns quoted in this article reflect the market weighted average returns of stocks that currently trade on American exchanges.
Have feedback on this article? Concerned about the content? Get in touch with us directly. Alternatively, email editorial-team (at) simplywallst.com.
This article by Simply Wall St is general in nature. We provide commentary based on historical data and analyst forecasts only using an unbiased methodology and our articles are not intended to be financial advice. It does not constitute a recommendation to buy or sell any stock, and does not take account of your objectives, or your financial situation. We aim to bring you long-term focused analysis driven by fundamental data. Note that our analysis may not factor in the latest price-sensitive company announcements or qualitative material. Simply Wall St has no position in any stocks mentioned.
Join A Paid User Research Session
You’ll receive a US$30 Amazon Gift card for 1 hour of your time while helping us build better investing tools for the individual investors like yourself. Sign up here
