
 Yahoo Finance
 Some Shareholders Feeling Restless Over The Westaim Corporation's (CVE:WED) P/E Ratio
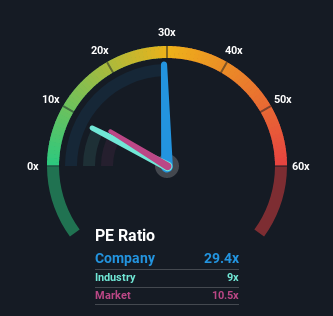
The Westaim Corporation's (CVE:WED) price-to-earnings (or "P/E") ratio of 29.4x might make it look like a strong sell right now compared to the market in Canada, where around half of the companies have P/E ratios below 10x and even P/E's below 4x are quite common. Nonetheless, we'd need to dig a little deeper to determine if there is a rational basis for the highly elevated P/E.
With earnings growth that's exceedingly strong of late, Westaim has been doing very well. It seems that many are expecting the strong earnings performance to beat most other companies over the coming period, which has increased investors’ willingness to pay up for the stock. You'd really hope so, otherwise you're paying a pretty hefty price for no particular reason.
See our latest analysis for Westaim
We don't have analyst forecasts, but you can see how recent trends are setting up the company for the future by checking out our free report on Westaim's earnings, revenue and cash flow.
What Are Growth Metrics Telling Us About The High P/E?
Westaim's P/E ratio would be typical for a company that's expected to deliver very strong growth, and importantly, perform much better than the market.
If we review the last year of earnings growth, the company posted a terrific increase of 68%. Despite this strong recent growth, it's still struggling to catch up as its three-year EPS frustratingly shrank by 64% overall. Therefore, it's fair to say the earnings growth recently has been undesirable for the company.
In contrast to the company, the rest of the market is expected to grow by 13% over the next year, which really puts the company's recent medium-term earnings decline into perspective.
In light of this, it's alarming that Westaim's P/E sits above the majority of other companies. It seems most investors are ignoring the recent poor growth rate and are hoping for a turnaround in the company's business prospects. Only the boldest would assume these prices are sustainable as a continuation of recent earnings trends is likely to weigh heavily on the share price eventually.
What We Can Learn From Westaim's P/E?
Generally, our preference is to limit the use of the price-to-earnings ratio to establishing what the market thinks about the overall health of a company.
Our examination of Westaim revealed its shrinking earnings over the medium-term aren't impacting its high P/E anywhere near as much as we would have predicted, given the market is set to grow. Right now we are increasingly uncomfortable with the high P/E as this earnings performance is highly unlikely to support such positive sentiment for long. If recent medium-term earnings trends continue, it will place shareholders' investments at significant risk and potential investors in danger of paying an excessive premium.
There are also other vital risk factors to consider before investing and we've discovered 1 warning sign for Westaim that you should be aware of.
Of course, you might also be able to find a better stock than Westaim. So you may wish to see this free collection of other companies that sit on P/E's below 20x and have grown earnings strongly.
Have feedback on this article? Concerned about the content? Get in touch with us directly. Alternatively, email editorial-team (at) simplywallst.com.
This article by Simply Wall St is general in nature. We provide commentary based on historical data and analyst forecasts only using an unbiased methodology and our articles are not intended to be financial advice. It does not constitute a recommendation to buy or sell any stock, and does not take account of your objectives, or your financial situation. We aim to bring you long-term focused analysis driven by fundamental data. Note that our analysis may not factor in the latest price-sensitive company announcements or qualitative material. Simply Wall St has no position in any stocks mentioned.
Join A Paid User Research Session
You’ll receive a US$30 Amazon Gift card for 1 hour of your time while helping us build better investing tools for the individual investors like yourself. Sign up here
