
 Yahoo Finance
 Semler Scientific (NASDAQ:SMLR) investors are sitting on a loss of 74% if they invested three years ago
Every investor on earth makes bad calls sometimes. But you want to avoid the really big losses like the plague. So take a moment to sympathize with the long term shareholders of Semler Scientific, Inc. (NASDAQ:SMLR), who have seen the share price tank a massive 74% over a three year period. That'd be enough to cause even the strongest minds some disquiet. Furthermore, it's down 38% in about a quarter. That's not much fun for holders.
Now let's have a look at the company's fundamentals, and see if the long term shareholder return has matched the performance of the underlying business.
View our latest analysis for Semler Scientific
In his essay The Superinvestors of Graham-and-Doddsville Warren Buffett described how share prices do not always rationally reflect the value of a business. One imperfect but simple way to consider how the market perception of a company has shifted is to compare the change in the earnings per share (EPS) with the share price movement.
Although the share price is down over three years, Semler Scientific actually managed to grow EPS by 11% per year in that time. This is quite a puzzle, and suggests there might be something temporarily buoying the share price. Alternatively, growth expectations may have been unreasonable in the past.
Since the change in EPS doesn't seem to correlate with the change in share price, it's worth taking a look at other metrics.
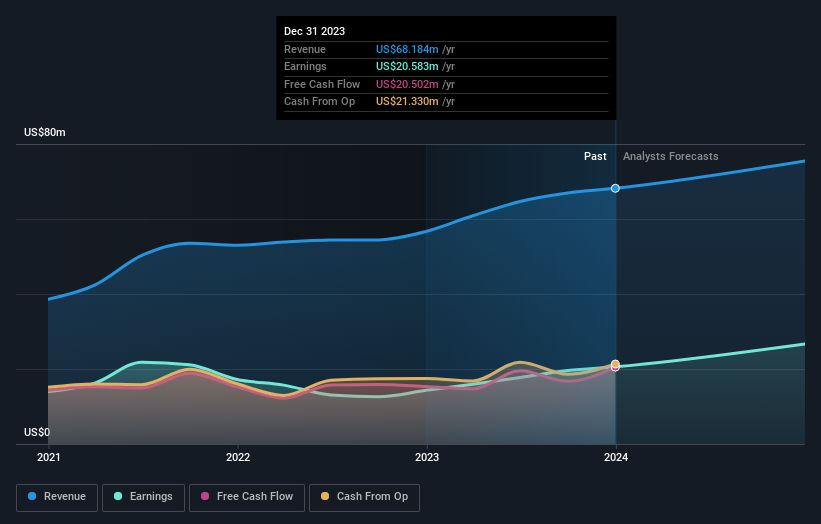
Revenue is actually up 15% over the three years, so the share price drop doesn't seem to hinge on revenue, either. This analysis is just perfunctory, but it might be worth researching Semler Scientific more closely, as sometimes stocks fall unfairly. This could present an opportunity.
You can see how earnings and revenue have changed over time in the image below (click on the chart to see the exact values).
We're pleased to report that the CEO is remunerated more modestly than most CEOs at similarly capitalized companies. It's always worth keeping an eye on CEO pay, but a more important question is whether the company will grow earnings throughout the years. So we recommend checking out this free report showing consensus forecasts
A Different Perspective
Semler Scientific shareholders are up 23% for the year. Unfortunately this falls short of the market return. On the bright side, that's still a gain, and it is certainly better than the yearly loss of about 7% endured over half a decade. It could well be that the business is stabilizing. I find it very interesting to look at share price over the long term as a proxy for business performance. But to truly gain insight, we need to consider other information, too. Even so, be aware that Semler Scientific is showing 1 warning sign in our investment analysis , you should know about...
But note: Semler Scientific may not be the best stock to buy. So take a peek at this free list of interesting companies with past earnings growth (and further growth forecast).
Please note, the market returns quoted in this article reflect the market weighted average returns of stocks that currently trade on American exchanges.
Have feedback on this article? Concerned about the content? Get in touch with us directly. Alternatively, email editorial-team (at) simplywallst.com.
This article by Simply Wall St is general in nature. We provide commentary based on historical data and analyst forecasts only using an unbiased methodology and our articles are not intended to be financial advice. It does not constitute a recommendation to buy or sell any stock, and does not take account of your objectives, or your financial situation. We aim to bring you long-term focused analysis driven by fundamental data. Note that our analysis may not factor in the latest price-sensitive company announcements or qualitative material. Simply Wall St has no position in any stocks mentioned.
