
 Yahoo Finance
 Scholium Group (LON:SCHO) Might Have The Makings Of A Multi-Bagger
If we want to find a potential multi-bagger, often there are underlying trends that can provide clues. One common approach is to try and find a company with returns on capital employed (ROCE) that are increasing, in conjunction with a growing amount of capital employed. Put simply, these types of businesses are compounding machines, meaning they are continually reinvesting their earnings at ever-higher rates of return. So when we looked at Scholium Group (LON:SCHO) and its trend of ROCE, we really liked what we saw.
Return On Capital Employed (ROCE): What Is It?
If you haven't worked with ROCE before, it measures the 'return' (pre-tax profit) a company generates from capital employed in its business. To calculate this metric for Scholium Group, this is the formula:
Return on Capital Employed = Earnings Before Interest and Tax (EBIT) ÷ (Total Assets - Current Liabilities)
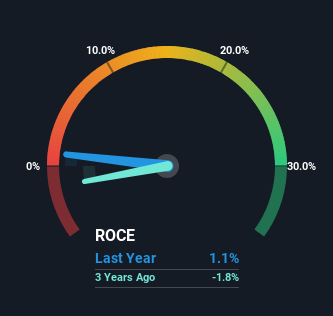
0.011 = UK£114k ÷ (UK£13m - UK£2.8m) (Based on the trailing twelve months to September 2023).
So, Scholium Group has an ROCE of 1.1%. Ultimately, that's a low return and it under-performs the Specialty Retail industry average of 14%.
View our latest analysis for Scholium Group
While the past is not representative of the future, it can be helpful to know how a company has performed historically, which is why we have this chart above. If you want to delve into the historical earnings , check out these free graphs detailing revenue and cash flow performance of Scholium Group.
What Can We Tell From Scholium Group's ROCE Trend?
Shareholders will be relieved that Scholium Group has broken into profitability. The company was generating losses five years ago, but has managed to turn it around and as we saw earlier is now earning 1.1%, which is always encouraging. Interestingly, the capital employed by the business has remained relatively flat, so these higher returns are either from prior investments paying off or increased efficiencies. That being said, while an increase in efficiency is no doubt appealing, it'd be helpful to know if the company does have any investment plans going forward. After all, a company can only become a long term multi-bagger if it continually reinvests in itself at high rates of return.
The Bottom Line
To bring it all together, Scholium Group has done well to increase the returns it's generating from its capital employed. Since the total return from the stock has been almost flat over the last five years, there might be an opportunity here if the valuation looks good. That being the case, research into the company's current valuation metrics and future prospects seems fitting.
If you want to know some of the risks facing Scholium Group we've found 2 warning signs (1 makes us a bit uncomfortable!) that you should be aware of before investing here.
While Scholium Group may not currently earn the highest returns, we've compiled a list of companies that currently earn more than 25% return on equity. Check out this free list here.
Have feedback on this article? Concerned about the content? Get in touch with us directly. Alternatively, email editorial-team (at) simplywallst.com.
This article by Simply Wall St is general in nature. We provide commentary based on historical data and analyst forecasts only using an unbiased methodology and our articles are not intended to be financial advice. It does not constitute a recommendation to buy or sell any stock, and does not take account of your objectives, or your financial situation. We aim to bring you long-term focused analysis driven by fundamental data. Note that our analysis may not factor in the latest price-sensitive company announcements or qualitative material. Simply Wall St has no position in any stocks mentioned.
