
 Yahoo Finance
 Schindler Holding (VTX:SCHN) May Have Issues Allocating Its Capital
To avoid investing in a business that's in decline, there's a few financial metrics that can provide early indications of aging. When we see a declining return on capital employed (ROCE) in conjunction with a declining base of capital employed, that's often how a mature business shows signs of aging. Ultimately this means that the company is earning less per dollar invested and on top of that, it's shrinking its base of capital employed. So after we looked into Schindler Holding (VTX:SCHN), the trends above didn't look too great.
Understanding Return On Capital Employed (ROCE)
For those that aren't sure what ROCE is, it measures the amount of pre-tax profits a company can generate from the capital employed in its business. Analysts use this formula to calculate it for Schindler Holding:
Return on Capital Employed = Earnings Before Interest and Tax (EBIT) ÷ (Total Assets - Current Liabilities)
0.19 = CHF1.1b ÷ (CHF11b - CHF5.6b) (Based on the trailing twelve months to September 2023).
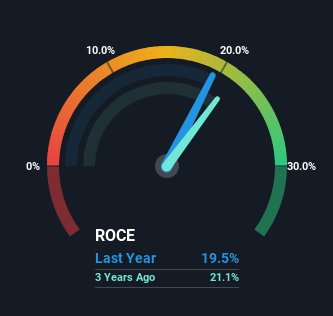
So, Schindler Holding has an ROCE of 19%. In absolute terms, that's a satisfactory return, but compared to the Machinery industry average of 15% it's much better.
View our latest analysis for Schindler Holding
In the above chart we have measured Schindler Holding's prior ROCE against its prior performance, but the future is arguably more important. If you're interested, you can view the analysts predictions in our free report on analyst forecasts for the company.
What Can We Tell From Schindler Holding's ROCE Trend?
We are a bit worried about the trend of returns on capital at Schindler Holding. About five years ago, returns on capital were 25%, however they're now substantially lower than that as we saw above. And on the capital employed front, the business is utilizing roughly the same amount of capital as it was back then. Since returns are falling and the business has the same amount of assets employed, this can suggest it's a mature business that hasn't had much growth in the last five years. So because these trends aren't typically conducive to creating a multi-bagger, we wouldn't hold our breath on Schindler Holding becoming one if things continue as they have.
On a side note, Schindler Holding's current liabilities are still rather high at 49% of total assets. This can bring about some risks because the company is basically operating with a rather large reliance on its suppliers or other sorts of short-term creditors. While it's not necessarily a bad thing, it can be beneficial if this ratio is lower.
In Conclusion...
In summary, it's unfortunate that Schindler Holding is generating lower returns from the same amount of capital. Investors must expect better things on the horizon though because the stock has risen 2.3% in the last five years. Either way, we aren't huge fans of the current trends and so with that we think you might find better investments elsewhere.
If you're still interested in Schindler Holding it's worth checking out our FREE intrinsic value approximation to see if it's trading at an attractive price in other respects.
While Schindler Holding isn't earning the highest return, check out this free list of companies that are earning high returns on equity with solid balance sheets.
Have feedback on this article? Concerned about the content? Get in touch with us directly. Alternatively, email editorial-team (at) simplywallst.com.
This article by Simply Wall St is general in nature. We provide commentary based on historical data and analyst forecasts only using an unbiased methodology and our articles are not intended to be financial advice. It does not constitute a recommendation to buy or sell any stock, and does not take account of your objectives, or your financial situation. We aim to bring you long-term focused analysis driven by fundamental data. Note that our analysis may not factor in the latest price-sensitive company announcements or qualitative material. Simply Wall St has no position in any stocks mentioned.
