
 Yahoo Finance
 Sanlam Limited's (JSE:SLM) top owners are individual investors with 58% stake, while 26% is held by institutions
Key Insights
The considerable ownership by individual investors in Sanlam indicates that they collectively have a greater say in management and business strategy
A total of 25 investors have a majority stake in the company with 37% ownership
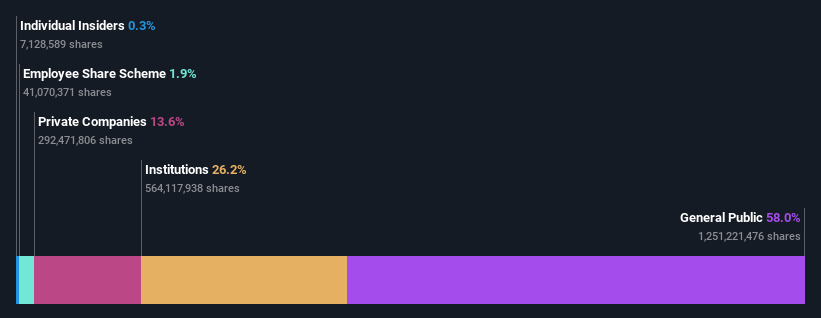
To get a sense of who is truly in control of Sanlam Limited (JSE:SLM), it is important to understand the ownership structure of the business. And the group that holds the biggest piece of the pie are individual investors with 58% ownership. That is, the group stands to benefit the most if the stock rises (or lose the most if there is a downturn).
And institutions on the other hand have a 26% ownership in the company. Large companies usually have institutions as shareholders, and we usually see insiders owning shares in smaller companies.
Let's delve deeper into each type of owner of Sanlam, beginning with the chart below.
Check out our latest analysis for Sanlam
What Does The Institutional Ownership Tell Us About Sanlam?
Institutions typically measure themselves against a benchmark when reporting to their own investors, so they often become more enthusiastic about a stock once it's included in a major index. We would expect most companies to have some institutions on the register, especially if they are growing.
As you can see, institutional investors have a fair amount of stake in Sanlam. This can indicate that the company has a certain degree of credibility in the investment community. However, it is best to be wary of relying on the supposed validation that comes with institutional investors. They too, get it wrong sometimes. If multiple institutions change their view on a stock at the same time, you could see the share price drop fast. It's therefore worth looking at Sanlam's earnings history below. Of course, the future is what really matters.

We note that hedge funds don't have a meaningful investment in Sanlam. Ubuntu-Botho Investments Pty Ltd. is currently the largest shareholder, with 14% of shares outstanding. In comparison, the second and third largest shareholders hold about 5.1% and 3.3% of the stock.
A deeper look at our ownership data shows that the top 25 shareholders collectively hold less than half of the register, suggesting a large group of small holders where no single shareholder has a majority.
While it makes sense to study institutional ownership data for a company, it also makes sense to study analyst sentiments to know which way the wind is blowing. There are a reasonable number of analysts covering the stock, so it might be useful to find out their aggregate view on the future.
Insider Ownership Of Sanlam
The definition of company insiders can be subjective and does vary between jurisdictions. Our data reflects individual insiders, capturing board members at the very least. Management ultimately answers to the board. However, it is not uncommon for managers to be executive board members, especially if they are a founder or the CEO.
Most consider insider ownership a positive because it can indicate the board is well aligned with other shareholders. However, on some occasions too much power is concentrated within this group.
Our most recent data indicates that insiders own less than 1% of Sanlam Limited. However, it's possible that insiders might have an indirect interest through a more complex structure. It is a very large company, so it would be surprising to see insiders own a large proportion of the company. Though their holding amounts to less than 1%, we can see that board members collectively own R525m worth of shares (at current prices). In this sort of situation, it can be more interesting to see if those insiders have been buying or selling.
General Public Ownership
The general public, mostly comprising of individual investors, collectively holds 58% of Sanlam shares. This level of ownership gives investors from the wider public some power to sway key policy decisions such as board composition, executive compensation, and the dividend payout ratio.
Private Company Ownership
Our data indicates that Private Companies hold 14%, of the company's shares. It's hard to draw any conclusions from this fact alone, so its worth looking into who owns those private companies. Sometimes insiders or other related parties have an interest in shares in a public company through a separate private company.
Next Steps:
It's always worth thinking about the different groups who own shares in a company. But to understand Sanlam better, we need to consider many other factors. Be aware that Sanlam is showing 1 warning sign in our investment analysis , you should know about...
If you would prefer discover what analysts are predicting in terms of future growth, do not miss this free report on analyst forecasts.
NB: Figures in this article are calculated using data from the last twelve months, which refer to the 12-month period ending on the last date of the month the financial statement is dated. This may not be consistent with full year annual report figures.
Have feedback on this article? Concerned about the content? Get in touch with us directly. Alternatively, email editorial-team (at) simplywallst.com.
This article by Simply Wall St is general in nature. We provide commentary based on historical data and analyst forecasts only using an unbiased methodology and our articles are not intended to be financial advice. It does not constitute a recommendation to buy or sell any stock, and does not take account of your objectives, or your financial situation. We aim to bring you long-term focused analysis driven by fundamental data. Note that our analysis may not factor in the latest price-sensitive company announcements or qualitative material. Simply Wall St has no position in any stocks mentioned.
