
 Yahoo Finance
 Ryerson Holding (NYSE:RYI) Knows How To Allocate Capital Effectively
If we want to find a stock that could multiply over the long term, what are the underlying trends we should look for? Typically, we'll want to notice a trend of growing return on capital employed (ROCE) and alongside that, an expanding base of capital employed. Ultimately, this demonstrates that it's a business that is reinvesting profits at increasing rates of return. So when we looked at the ROCE trend of Ryerson Holding (NYSE:RYI) we really liked what we saw.
Understanding Return On Capital Employed (ROCE)
If you haven't worked with ROCE before, it measures the 'return' (pre-tax profit) a company generates from capital employed in its business. Analysts use this formula to calculate it for Ryerson Holding:
Return on Capital Employed = Earnings Before Interest and Tax (EBIT) ÷ (Total Assets - Current Liabilities)
0.41 = US$749m ÷ (US$2.5b - US$705m) (Based on the trailing twelve months to September 2022).
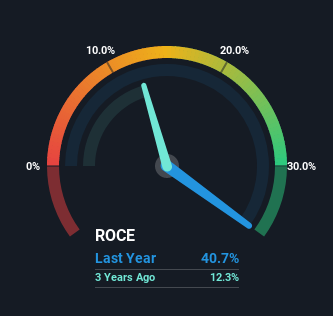
So, Ryerson Holding has an ROCE of 41%. In absolute terms that's a great return and it's even better than the Metals and Mining industry average of 18%.
View our latest analysis for Ryerson Holding
In the above chart we have measured Ryerson Holding's prior ROCE against its prior performance, but the future is arguably more important. If you'd like to see what analysts are forecasting going forward, you should check out our free report for Ryerson Holding.
What Can We Tell From Ryerson Holding's ROCE Trend?
Investors would be pleased with what's happening at Ryerson Holding. The data shows that returns on capital have increased substantially over the last five years to 41%. Basically the business is earning more per dollar of capital invested and in addition to that, 39% more capital is being employed now too. This can indicate that there's plenty of opportunities to invest capital internally and at ever higher rates, a combination that's common among multi-baggers.
The Bottom Line On Ryerson Holding's ROCE
All in all, it's terrific to see that Ryerson Holding is reaping the rewards from prior investments and is growing its capital base. And with the stock having performed exceptionally well over the last five years, these patterns are being accounted for by investors. In light of that, we think it's worth looking further into this stock because if Ryerson Holding can keep these trends up, it could have a bright future ahead.
Like most companies, Ryerson Holding does come with some risks, and we've found 2 warning signs that you should be aware of.
High returns are a key ingredient to strong performance, so check out our free list ofstocks earning high returns on equity with solid balance sheets.
Have feedback on this article? Concerned about the content? Get in touch with us directly. Alternatively, email editorial-team (at) simplywallst.com.
This article by Simply Wall St is general in nature. We provide commentary based on historical data and analyst forecasts only using an unbiased methodology and our articles are not intended to be financial advice. It does not constitute a recommendation to buy or sell any stock, and does not take account of your objectives, or your financial situation. We aim to bring you long-term focused analysis driven by fundamental data. Note that our analysis may not factor in the latest price-sensitive company announcements or qualitative material. Simply Wall St has no position in any stocks mentioned.
Join A Paid User Research Session
You’ll receive a US$30 Amazon Gift card for 1 hour of your time while helping us build better investing tools for the individual investors like yourself. Sign up here
