
 Yahoo Finance
 What Is Russel Metals's (TSE:RUS) P/E Ratio After Its Share Price Tanked?

To the annoyance of some shareholders, Russel Metals (TSE:RUS) shares are down a considerable 34% in the last month. That drop has capped off a tough year for shareholders, with the share price down 40% in that time.
All else being equal, a share price drop should make a stock more attractive to potential investors. While the market sentiment towards a stock is very changeable, in the long run, the share price will tend to move in the same direction as earnings per share. So, on certain occasions, long term focussed investors try to take advantage of pessimistic expectations to buy shares at a better price. One way to gauge market expectations of a stock is to look at its Price to Earnings Ratio (PE Ratio). A high P/E implies that investors have high expectations of what a company can achieve compared to a company with a low P/E ratio.
View our latest analysis for Russel Metals
Does Russel Metals Have A Relatively High Or Low P/E For Its Industry?
Russel Metals's P/E of 11.57 indicates some degree of optimism towards the stock. The image below shows that Russel Metals has a higher P/E than the average (10.3) P/E for companies in the trade distributors industry.
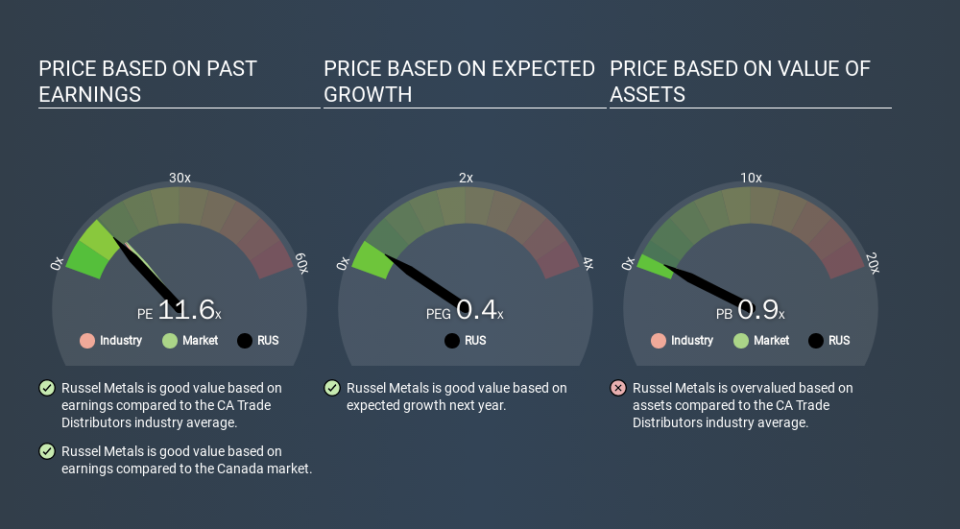
Russel Metals's P/E tells us that market participants think the company will perform better than its industry peers, going forward. The market is optimistic about the future, but that doesn't guarantee future growth. So further research is always essential. I often monitor director buying and selling.
How Growth Rates Impact P/E Ratios
P/E ratios primarily reflect market expectations around earnings growth rates. That's because companies that grow earnings per share quickly will rapidly increase the 'E' in the equation. Therefore, even if you pay a high multiple of earnings now, that multiple will become lower in the future. A lower P/E should indicate the stock is cheap relative to others -- and that may attract buyers.
Russel Metals saw earnings per share decrease by 65% last year. But it has grown its earnings per share by 6.6% per year over the last three years. And EPS is down 9.3% a year, over the last 5 years. This could justify a pessimistic P/E.
Remember: P/E Ratios Don't Consider The Balance Sheet
One drawback of using a P/E ratio is that it considers market capitalization, but not the balance sheet. In other words, it does not consider any debt or cash that the company may have on the balance sheet. In theory, a company can lower its future P/E ratio by using cash or debt to invest in growth.
Spending on growth might be good or bad a few years later, but the point is that the P/E ratio does not account for the option (or lack thereof).
How Does Russel Metals's Debt Impact Its P/E Ratio?
Net debt totals 55% of Russel Metals's market cap. This is enough debt that you'd have to make some adjustments before using the P/E ratio to compare it to a company with net cash.
The Bottom Line On Russel Metals's P/E Ratio
Russel Metals trades on a P/E ratio of 11.6, which is fairly close to the CA market average of 11.6. With relatively high debt, and no earnings per share growth over twelve months, the P/E suggests that many have an expectation that company will find some growth. What can be absolutely certain is that the market has become significantly less optimistic about Russel Metals over the last month, with the P/E ratio falling from 17.6 back then to 11.6 today. For those who prefer to invest with the flow of momentum, that might be a bad sign, but for a contrarian, it may signal opportunity.
When the market is wrong about a stock, it gives savvy investors an opportunity. If the reality for a company is not as bad as the P/E ratio indicates, then the share price should increase as the market realizes this. So this free report on the analyst consensus forecasts could help you make a master move on this stock.
Of course, you might find a fantastic investment by looking at a few good candidates. So take a peek at this free list of companies with modest (or no) debt, trading on a P/E below 20.
If you spot an error that warrants correction, please contact the editor at editorial-team@simplywallst.com. This article by Simply Wall St is general in nature. It does not constitute a recommendation to buy or sell any stock, and does not take account of your objectives, or your financial situation. Simply Wall St has no position in the stocks mentioned.
We aim to bring you long-term focused research analysis driven by fundamental data. Note that our analysis may not factor in the latest price-sensitive company announcements or qualitative material. Thank you for reading.
