
 Yahoo Finance
 With An ROE Of 8.56%, Has Suncor Energy Inc’s (TSE:SU) Management Done Well?

This article is intended for those of you who are at the beginning of your investing journey and want to better understand how you can grow your money by investing in Suncor Energy Inc (TSE:SU).
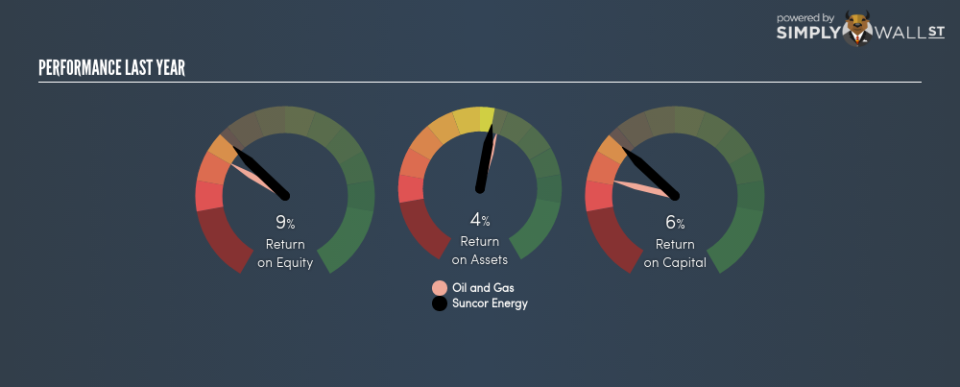
Suncor Energy Inc (TSE:SU) outperformed the Integrated Oil and Gas industry on the basis of its ROE – producing a higher 8.56% relative to the peer average of 6.50% over the past 12 months. Superficially, this looks great since we know that SU has generated big profits with little equity capital; however, ROE doesn’t tell us how much SU has borrowed in debt. We’ll take a closer look today at factors like financial leverage to determine whether SU’s ROE is actually sustainable. See our latest analysis for Suncor Energy
Breaking down Return on Equity
Return on Equity (ROE) is a measure of Suncor Energy’s profit relative to its shareholders’ equity. It essentially shows how much the company can generate in earnings given the amount of equity it has raised. In most cases, a higher ROE is preferred; however, there are many other factors we must consider prior to making any investment decisions.
Return on Equity = Net Profit ÷ Shareholders Equity
ROE is assessed against cost of equity, which is measured using the Capital Asset Pricing Model (CAPM) – but let’s not dive into the details of that today. For now, let’s just look at the cost of equity number for Suncor Energy, which is 11.74%. Since Suncor Energy’s return does not cover its cost, with a difference of -3.18%, this means its current use of equity is not efficient and not sustainable. Very simply, Suncor Energy pays more for its capital than what it generates in return. ROE can be broken down into three different ratios: net profit margin, asset turnover, and financial leverage. This is called the Dupont Formula:
Dupont Formula
ROE = profit margin × asset turnover × financial leverage
ROE = (annual net profit ÷ sales) × (sales ÷ assets) × (assets ÷ shareholders’ equity)
ROE = annual net profit ÷ shareholders’ equity
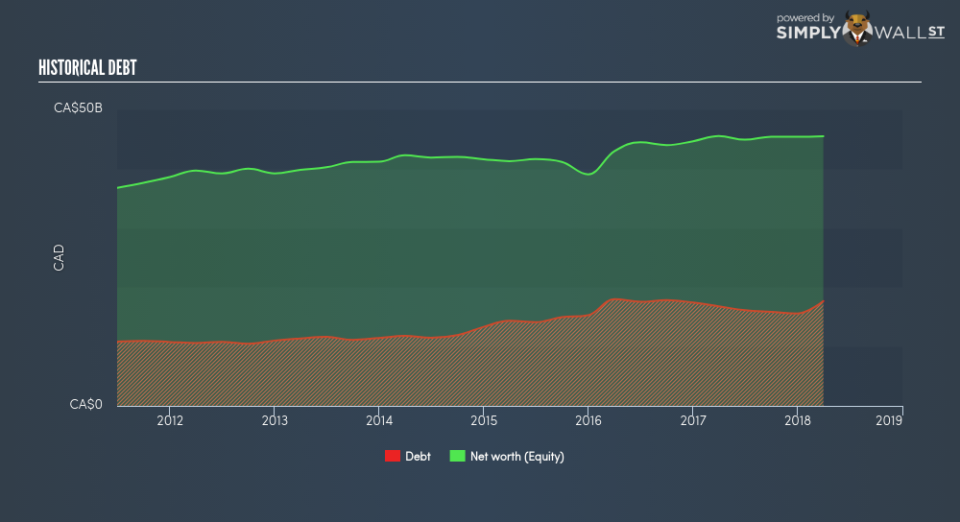
Basically, profit margin measures how much of revenue trickles down into earnings which illustrates how efficient the business is with its cost management. The other component, asset turnover, illustrates how much revenue Suncor Energy can make from its asset base. The most interesting ratio, and reflective of sustainability of its ROE, is financial leverage. Since ROE can be artificially increased through excessive borrowing, we should check Suncor Energy’s historic debt-to-equity ratio. At 38.89%, Suncor Energy’s debt-to-equity ratio appears low and indicates the above-average ROE is generated from its capacity to increase profit without a large debt burden.
Next Steps:
ROE is one of many ratios which meaningfully dissects financial statements, which illustrates the quality of a company. Suncor Energy’s above-industry ROE is noteworthy, but it was not high enough to cover its own cost of equity. Its high ROE is not likely to be driven by high debt. Therefore, investors may have more confidence in the sustainability of this level of returns going forward. Although ROE can be a useful metric, it is only a small part of diligent research.
For Suncor Energy, I’ve put together three essential aspects you should further research:
Financial Health: Does it have a healthy balance sheet? Take a look at our free balance sheet analysis with six simple checks on key factors like leverage and risk.
Valuation: What is Suncor Energy worth today? Is the stock undervalued, even when its growth outlook is factored into its intrinsic value? The intrinsic value infographic in our free research report helps visualize whether Suncor Energy is currently mispriced by the market.
Other High-Growth Alternatives : Are there other high-growth stocks you could be holding instead of Suncor Energy? Explore our interactive list of stocks with large growth potential to get an idea of what else is out there you may be missing!
To help readers see pass the short term volatility of the financial market, we aim to bring you a long-term focused research analysis purely driven by fundamental data. Note that our analysis does not factor in the latest price sensitive company announcements.
The author is an independent contributor and at the time of publication had no position in the stocks mentioned.
