
 Yahoo Finance
 Robinson (LON:RBN) Has Some Way To Go To Become A Multi-Bagger
If we want to find a potential multi-bagger, often there are underlying trends that can provide clues. Firstly, we'll want to see a proven return on capital employed (ROCE) that is increasing, and secondly, an expanding base of capital employed. If you see this, it typically means it's a company with a great business model and plenty of profitable reinvestment opportunities. However, after investigating Robinson (LON:RBN), we don't think it's current trends fit the mold of a multi-bagger.
What Is Return On Capital Employed (ROCE)?
Just to clarify if you're unsure, ROCE is a metric for evaluating how much pre-tax income (in percentage terms) a company earns on the capital invested in its business. To calculate this metric for Robinson, this is the formula:
Return on Capital Employed = Earnings Before Interest and Tax (EBIT) ÷ (Total Assets - Current Liabilities)
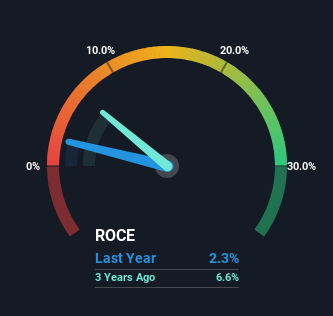
0.023 = UK£764k ÷ (UK£47m - UK£14m) (Based on the trailing twelve months to December 2023).
So, Robinson has an ROCE of 2.3%. Ultimately, that's a low return and it under-performs the Packaging industry average of 11%.
Check out our latest analysis for Robinson
In the above chart we have measured Robinson's prior ROCE against its prior performance, but the future is arguably more important. If you're interested, you can view the analysts predictions in our free analyst report for Robinson .
What Does the ROCE Trend For Robinson Tell Us?
Over the past five years, Robinson's ROCE and capital employed have both remained mostly flat. It's not uncommon to see this when looking at a mature and stable business that isn't re-investing its earnings because it has likely passed that phase of the business cycle. With that in mind, unless investment picks up again in the future, we wouldn't expect Robinson to be a multi-bagger going forward. This probably explains why Robinson is paying out 56% of its income to shareholders in the form of dividends. Unless businesses have highly compelling growth opportunities, they'll typically return some money to shareholders.
Our Take On Robinson's ROCE
In a nutshell, Robinson has been trudging along with the same returns from the same amount of capital over the last five years. Since the stock has gained an impressive 75% over the last five years, investors must think there's better things to come. However, unless these underlying trends turn more positive, we wouldn't get our hopes up too high.
Since virtually every company faces some risks, it's worth knowing what they are, and we've spotted 3 warning signs for Robinson (of which 2 are a bit concerning!) that you should know about.
While Robinson may not currently earn the highest returns, we've compiled a list of companies that currently earn more than 25% return on equity. Check out this free list here.
Have feedback on this article? Concerned about the content? Get in touch with us directly. Alternatively, email editorial-team (at) simplywallst.com.
This article by Simply Wall St is general in nature. We provide commentary based on historical data and analyst forecasts only using an unbiased methodology and our articles are not intended to be financial advice. It does not constitute a recommendation to buy or sell any stock, and does not take account of your objectives, or your financial situation. We aim to bring you long-term focused analysis driven by fundamental data. Note that our analysis may not factor in the latest price-sensitive company announcements or qualitative material. Simply Wall St has no position in any stocks mentioned.
Have feedback on this article? Concerned about the content? Get in touch with us directly. Alternatively, email editorial-team@simplywallst.com
