
 Yahoo Finance
 Is Robex Resources Inc.'s (CVE:RBX) Recent Stock Performance Tethered To Its Strong Fundamentals?
Robex Resources (CVE:RBX) has had a great run on the share market with its stock up by a significant 16% over the last three months. Given the company's impressive performance, we decided to study its financial indicators more closely as a company's financial health over the long-term usually dictates market outcomes. Specifically, we decided to study Robex Resources' ROE in this article.
Return on equity or ROE is a key measure used to assess how efficiently a company's management is utilizing the company's capital. In simpler terms, it measures the profitability of a company in relation to shareholder's equity.
See our latest analysis for Robex Resources
How Is ROE Calculated?
Return on equity can be calculated by using the formula:
Return on Equity = Net Profit (from continuing operations) ÷ Shareholders' Equity
So, based on the above formula, the ROE for Robex Resources is:
11% = CA$23m ÷ CA$214m (Based on the trailing twelve months to September 2023).
The 'return' is the yearly profit. One way to conceptualize this is that for each CA$1 of shareholders' capital it has, the company made CA$0.11 in profit.
Why Is ROE Important For Earnings Growth?
So far, we've learned that ROE is a measure of a company's profitability. Based on how much of its profits the company chooses to reinvest or "retain", we are then able to evaluate a company's future ability to generate profits. Assuming all else is equal, companies that have both a higher return on equity and higher profit retention are usually the ones that have a higher growth rate when compared to companies that don't have the same features.
Robex Resources' Earnings Growth And 11% ROE
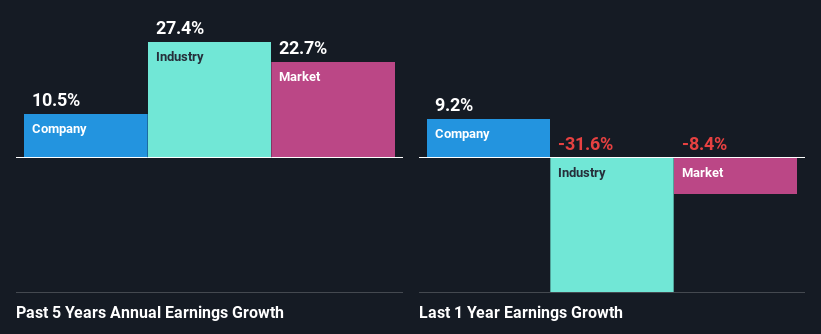
At first glance, Robex Resources seems to have a decent ROE. On comparing with the average industry ROE of 8.1% the company's ROE looks pretty remarkable. Probably as a result of this, Robex Resources was able to see a decent growth of 11% over the last five years.
We then compared Robex Resources' net income growth with the industry and found that the company's growth figure is lower than the average industry growth rate of 27% in the same 5-year period, which is a bit concerning.
Earnings growth is a huge factor in stock valuation. It’s important for an investor to know whether the market has priced in the company's expected earnings growth (or decline). This then helps them determine if the stock is placed for a bright or bleak future. If you're wondering about Robex Resources''s valuation, check out this gauge of its price-to-earnings ratio, as compared to its industry.
Is Robex Resources Efficiently Re-investing Its Profits?
Given that Robex Resources doesn't pay any dividend to its shareholders, we infer that the company has been reinvesting all of its profits to grow its business.
Summary
On the whole, we feel that Robex Resources' performance has been quite good. Specifically, we like that the company is reinvesting a huge chunk of its profits at a high rate of return. This of course has caused the company to see a good amount of growth in its earnings.
Have feedback on this article? Concerned about the content? Get in touch with us directly. Alternatively, email editorial-team (at) simplywallst.com.
This article by Simply Wall St is general in nature. We provide commentary based on historical data and analyst forecasts only using an unbiased methodology and our articles are not intended to be financial advice. It does not constitute a recommendation to buy or sell any stock, and does not take account of your objectives, or your financial situation. We aim to bring you long-term focused analysis driven by fundamental data. Note that our analysis may not factor in the latest price-sensitive company announcements or qualitative material. Simply Wall St has no position in any stocks mentioned.
