
 Yahoo Finance
 Robex Resources Inc. (CVE:RBX) Is Employing Capital Very Effectively

Today we'll look at Robex Resources Inc. (CVE:RBX) and reflect on its potential as an investment. Specifically, we'll consider its Return On Capital Employed (ROCE), since that will give us an insight into how efficiently the business can generate profits from the capital it requires.
First of all, we'll work out how to calculate ROCE. Then we'll compare its ROCE to similar companies. Finally, we'll look at how its current liabilities affect its ROCE.
Return On Capital Employed (ROCE): What is it?
ROCE is a measure of a company's yearly pre-tax profit (its return), relative to the capital employed in the business. All else being equal, a better business will have a higher ROCE. Overall, it is a valuable metric that has its flaws. Author Edwin Whiting says to be careful when comparing the ROCE of different businesses, since 'No two businesses are exactly alike.'
So, How Do We Calculate ROCE?
The formula for calculating the return on capital employed is:
Return on Capital Employed = Earnings Before Interest and Tax (EBIT) ÷ (Total Assets - Current Liabilities)
Or for Robex Resources:
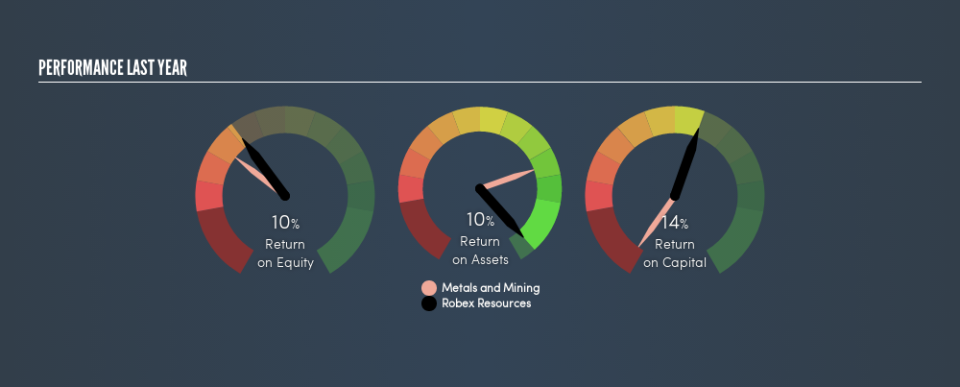
0.14 = CA$11m ÷ (CA$104m - CA$23m) (Based on the trailing twelve months to March 2019.)
So, Robex Resources has an ROCE of 14%.
View our latest analysis for Robex Resources
Is Robex Resources's ROCE Good?
When making comparisons between similar businesses, investors may find ROCE useful. Robex Resources's ROCE appears to be substantially greater than the 3.0% average in the Metals and Mining industry. We consider this a positive sign, because it suggests it uses capital more efficiently than similar companies. Separate from Robex Resources's performance relative to its industry, its ROCE in absolute terms looks satisfactory, and it may be worth researching in more depth.
Robex Resources delivered an ROCE of 14%, which is better than 3 years ago, as was making losses back then. That implies the business has been improving. The image below shows how Robex Resources's ROCE compares to its industry, and you can click it to see more detail on its past growth.
It is important to remember that ROCE shows past performance, and is not necessarily predictive. ROCE can be misleading for companies in cyclical industries, with returns looking impressive during the boom times, but very weak during the busts. ROCE is, after all, simply a snap shot of a single year. Given the industry it operates in, Robex Resources could be considered cyclical. How cyclical is Robex Resources? You can see for yourself by looking at this free graph of past earnings, revenue and cash flow.
How Robex Resources's Current Liabilities Impact Its ROCE
Current liabilities include invoices, such as supplier payments, short-term debt, or a tax bill, that need to be paid within 12 months. Due to the way ROCE is calculated, a high level of current liabilities makes a company look as though it has less capital employed, and thus can (sometimes unfairly) boost the ROCE. To counteract this, we check if a company has high current liabilities, relative to its total assets.
Robex Resources has total assets of CA$104m and current liabilities of CA$23m. Therefore its current liabilities are equivalent to approximately 23% of its total assets. Low current liabilities are not boosting the ROCE too much.
Our Take On Robex Resources's ROCE
With that in mind, Robex Resources's ROCE appears pretty good. Robex Resources looks strong on this analysis, but there are plenty of other companies that could be a good opportunity . Here is a free list of companies growing earnings rapidly.
If you are like me, then you will not want to miss this free list of growing companies that insiders are buying.
We aim to bring you long-term focused research analysis driven by fundamental data. Note that our analysis may not factor in the latest price-sensitive company announcements or qualitative material.
If you spot an error that warrants correction, please contact the editor at editorial-team@simplywallst.com. This article by Simply Wall St is general in nature. It does not constitute a recommendation to buy or sell any stock, and does not take account of your objectives, or your financial situation. Simply Wall St has no position in the stocks mentioned. Thank you for reading.
