
 Yahoo Finance
 Robex Resources Inc. (CVE:RBX) Doing What It Can To Lift Shares
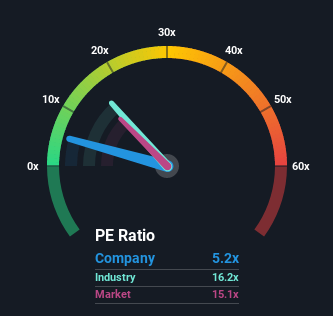
With a price-to-earnings (or "P/E") ratio of 5.2x Robex Resources Inc. (CVE:RBX) may be sending very bullish signals at the moment, given that almost half of all companies in Canada have P/E ratios greater than 16x and even P/E's higher than 34x are not unusual. However, the P/E might be quite low for a reason and it requires further investigation to determine if it's justified.
Recent times have been quite advantageous for Robex Resources as its earnings have been rising very briskly. One possibility is that the P/E is low because investors think this strong earnings growth might actually underperform the broader market in the near future. If you like the company, you'd be hoping this isn't the case so that you could potentially pick up some stock while it's out of favour.
See our latest analysis for Robex Resources
Although there are no analyst estimates available for Robex Resources, take a look at this free data-rich visualisation to see how the company stacks up on earnings, revenue and cash flow.
What Are Growth Metrics Telling Us About The Low P/E?
There's an inherent assumption that a company should far underperform the market for P/E ratios like Robex Resources' to be considered reasonable.
Retrospectively, the last year delivered an exceptional 56% gain to the company's bottom line. The latest three year period has also seen an excellent 238% overall rise in EPS, aided by its short-term performance. Accordingly, shareholders would have probably welcomed those medium-term rates of earnings growth.
Comparing that to the market, which is only predicted to deliver 22% growth in the next 12 months, the company's momentum is stronger based on recent medium-term annualised earnings results.
In light of this, it's peculiar that Robex Resources' P/E sits below the majority of other companies. Apparently some shareholders believe the recent performance has exceeded its limits and have been accepting significantly lower selling prices.
The Bottom Line On Robex Resources' P/E
It's argued the price-to-earnings ratio is an inferior measure of value within certain industries, but it can be a powerful business sentiment indicator.
Our examination of Robex Resources revealed its three-year earnings trends aren't contributing to its P/E anywhere near as much as we would have predicted, given they look better than current market expectations. When we see strong earnings with faster-than-market growth, we assume potential risks are what might be placing significant pressure on the P/E ratio. At least price risks look to be very low if recent medium-term earnings trends continue, but investors seem to think future earnings could see a lot of volatility.
We don't want to rain on the parade too much, but we did also find 3 warning signs for Robex Resources (1 is a bit unpleasant!) that you need to be mindful of.
If these risks are making you reconsider your opinion on Robex Resources, explore our interactive list of high quality stocks to get an idea of what else is out there.
This article by Simply Wall St is general in nature. It does not constitute a recommendation to buy or sell any stock, and does not take account of your objectives, or your financial situation. We aim to bring you long-term focused analysis driven by fundamental data. Note that our analysis may not factor in the latest price-sensitive company announcements or qualitative material. Simply Wall St has no position in any stocks mentioned.
Have feedback on this article? Concerned about the content? Get in touch with us directly. Alternatively, email editorial-team (at) simplywallst.com.
