
 Yahoo Finance
 A Rising Share Price Has Us Looking Closely At Newmark Group, Inc.'s (NASDAQ:NMRK) P/E Ratio

The Newmark Group (NASDAQ:NMRK) share price has done well in the last month, posting a gain of 31%. And the full year gain of 18% isn't too shabby, either!
Assuming no other changes, a sharply higher share price makes a stock less attractive to potential buyers. In the long term, share prices tend to follow earnings per share, but in the short term prices bounce around in response to short term factors (which are not always obvious). So some would prefer to hold off buying when there is a lot of optimism towards a stock. Perhaps the simplest way to get a read on investors' expectations of a business is to look at its Price to Earnings Ratio (PE Ratio). A high P/E ratio means that investors have a high expectation about future growth, while a low P/E ratio means they have low expectations about future growth.
View our latest analysis for Newmark Group
How Does Newmark Group's P/E Ratio Compare To Its Peers?
Newmark Group's P/E of 15.19 indicates relatively low sentiment towards the stock. The image below shows that Newmark Group has a lower P/E than the average (23.2) P/E for companies in the real estate industry.
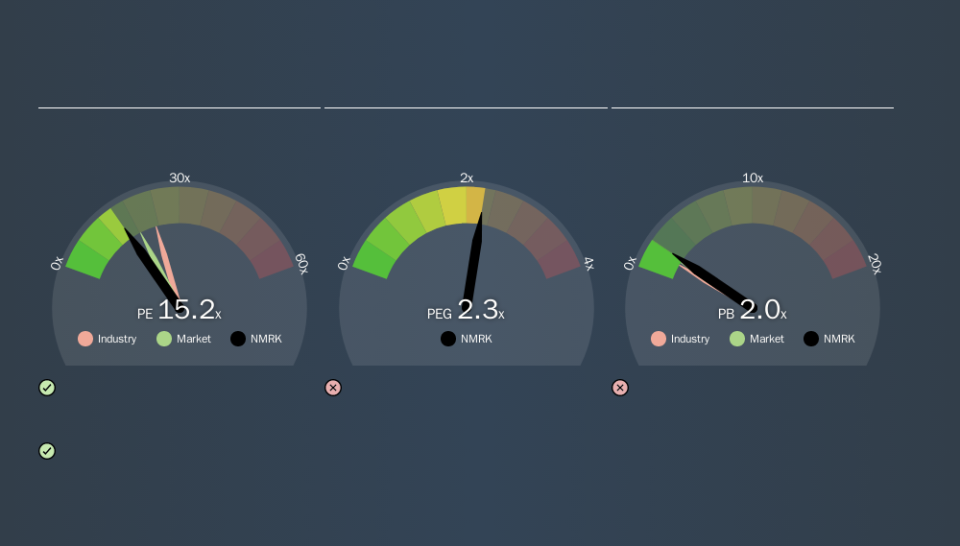
Its relatively low P/E ratio indicates that Newmark Group shareholders think it will struggle to do as well as other companies in its industry classification. Many investors like to buy stocks when the market is pessimistic about their prospects. It is arguably worth checking if insiders are buying shares, because that might imply they believe the stock is undervalued.
How Growth Rates Impact P/E Ratios
P/E ratios primarily reflect market expectations around earnings growth rates. When earnings grow, the 'E' increases, over time. Therefore, even if you pay a high multiple of earnings now, that multiple will become lower in the future. A lower P/E should indicate the stock is cheap relative to others -- and that may attract buyers.
In the last year, Newmark Group grew EPS like Taylor Swift grew her fan base back in 2010; the 189% gain was both fast and well deserved.
Remember: P/E Ratios Don't Consider The Balance Sheet
The 'Price' in P/E reflects the market capitalization of the company. That means it doesn't take debt or cash into account. The exact same company would hypothetically deserve a higher P/E ratio if it had a strong balance sheet, than if it had a weak one with lots of debt, because a cashed up company can spend on growth.
Spending on growth might be good or bad a few years later, but the point is that the P/E ratio does not account for the option (or lack thereof).
So What Does Newmark Group's Balance Sheet Tell Us?
Newmark Group's net debt equates to 29% of its market capitalization. While it's worth keeping this in mind, it isn't a worry.
The Bottom Line On Newmark Group's P/E Ratio
Newmark Group has a P/E of 15.2. That's below the average in the US market, which is 18.3. The EPS growth last year was strong, and debt levels are quite reasonable. If it continues to grow, then the current low P/E may prove to be unjustified. Given analysts are expecting further growth, one might have expected a higher P/E ratio. That may be worth further research. What we know for sure is that investors have become more excited about Newmark Group recently, since they have pushed its P/E ratio from 11.6 to 15.2 over the last month. For those who prefer to invest with the flow of momentum, that might mean it's time to put the stock on a watchlist, or research it. But the contrarian may see it as a missed opportunity.
When the market is wrong about a stock, it gives savvy investors an opportunity. If it is underestimating a company, investors can make money by buying and holding the shares until the market corrects itself. So this free visualization of the analyst consensus on future earnings could help you make the right decision about whether to buy, sell, or hold.
But note: Newmark Group may not be the best stock to buy. So take a peek at this free list of interesting companies with strong recent earnings growth (and a P/E ratio below 20).
We aim to bring you long-term focused research analysis driven by fundamental data. Note that our analysis may not factor in the latest price-sensitive company announcements or qualitative material.
If you spot an error that warrants correction, please contact the editor at editorial-team@simplywallst.com. This article by Simply Wall St is general in nature. It does not constitute a recommendation to buy or sell any stock, and does not take account of your objectives, or your financial situation. Simply Wall St has no position in the stocks mentioned. Thank you for reading.
