
 Yahoo Finance
 A Rising Share Price Has Us Looking Closely At SYNNEX Corporation's (NYSE:SNX) P/E Ratio

Those holding SYNNEX (NYSE:SNX) shares must be pleased that the share price has rebounded 46% in the last thirty days. But unfortunately, the stock is still down by 28% over a quarter. However, the annual gain of 10.0% wasn't so impressive.
All else being equal, a sharp share price increase should make a stock less attractive to potential investors. While the market sentiment towards a stock is very changeable, in the long run, the share price will tend to move in the same direction as earnings per share. The implication here is that deep value investors might steer clear when expectations of a company are too high. One way to gauge market expectations of a stock is to look at its Price to Earnings Ratio (PE Ratio). A high P/E ratio means that investors have a high expectation about future growth, while a low P/E ratio means they have low expectations about future growth.
See our latest analysis for SYNNEX
How Does SYNNEX's P/E Ratio Compare To Its Peers?
SYNNEX's P/E of 9.79 indicates relatively low sentiment towards the stock. The image below shows that SYNNEX has a lower P/E than the average (18.8) P/E for companies in the electronic industry.
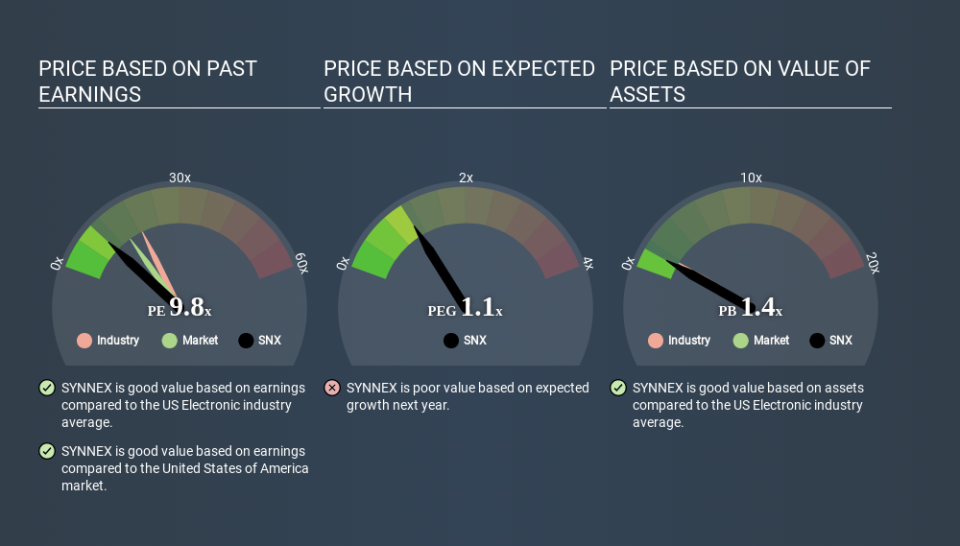
SYNNEX's P/E tells us that market participants think it will not fare as well as its peers in the same industry. While current expectations are low, the stock could be undervalued if the situation is better than the market assumes. It is arguably worth checking if insiders are buying shares, because that might imply they believe the stock is undervalued.
How Growth Rates Impact P/E Ratios
P/E ratios primarily reflect market expectations around earnings growth rates. If earnings are growing quickly, then the 'E' in the equation will increase faster than it would otherwise. Therefore, even if you pay a high multiple of earnings now, that multiple will become lower in the future. And as that P/E ratio drops, the company will look cheap, unless its share price increases.
SYNNEX increased earnings per share by a whopping 28% last year. And its annual EPS growth rate over 5 years is 17%. So we'd generally expect it to have a relatively high P/E ratio.
Don't Forget: The P/E Does Not Account For Debt or Bank Deposits
It's important to note that the P/E ratio considers the market capitalization, not the enterprise value. In other words, it does not consider any debt or cash that the company may have on the balance sheet. Hypothetically, a company could reduce its future P/E ratio by spending its cash (or taking on debt) to achieve higher earnings.
Spending on growth might be good or bad a few years later, but the point is that the P/E ratio does not account for the option (or lack thereof).
Is Debt Impacting SYNNEX's P/E?
Net debt totals 55% of SYNNEX's market cap. This is enough debt that you'd have to make some adjustments before using the P/E ratio to compare it to a company with net cash.
The Bottom Line On SYNNEX's P/E Ratio
SYNNEX trades on a P/E ratio of 9.8, which is below the US market average of 14.8. While the EPS growth last year was strong, the significant debt levels reduce the number of options available to management. The low P/E ratio suggests current market expectations are muted, implying these levels of growth will not continue. What is very clear is that the market has become less pessimistic about SYNNEX over the last month, with the P/E ratio rising from 6.7 back then to 9.8 today. For those who like to invest in turnarounds, that might mean it's time to put the stock on a watchlist, or research it. But others might consider the opportunity to have passed.
When the market is wrong about a stock, it gives savvy investors an opportunity. If it is underestimating a company, investors can make money by buying and holding the shares until the market corrects itself. So this free report on the analyst consensus forecasts could help you make a master move on this stock.
But note: SYNNEX may not be the best stock to buy. So take a peek at this free list of interesting companies with strong recent earnings growth (and a P/E ratio below 20).
Love or hate this article? Concerned about the content? Get in touch with us directly. Alternatively, email editorial-team@simplywallst.com.
This article by Simply Wall St is general in nature. It does not constitute a recommendation to buy or sell any stock, and does not take account of your objectives, or your financial situation. We aim to bring you long-term focused analysis driven by fundamental data. Note that our analysis may not factor in the latest price-sensitive company announcements or qualitative material. Simply Wall St has no position in any stocks mentioned. Thank you for reading.
