
 Yahoo Finance
 A Rising Share Price Has Us Looking Closely At Firan Technology Group Corporation's (TSE:FTG) P/E Ratio
Firan Technology Group (TSE:FTG) shareholders are no doubt pleased to see that the share price has bounced 34% in the last month alone, although it is still down 45% over the last quarter. But shareholders may not all be feeling jubilant, since the share price is still down 32% in the last year.
Assuming no other changes, a sharply higher share price makes a stock less attractive to potential buyers. In the long term, share prices tend to follow earnings per share, but in the short term prices bounce around in response to short term factors (which are not always obvious). The implication here is that deep value investors might steer clear when expectations of a company are too high. Perhaps the simplest way to get a read on investors' expectations of a business is to look at its Price to Earnings Ratio (PE Ratio). Investors have optimistic expectations of companies with higher P/E ratios, compared to companies with lower P/E ratios.
View our latest analysis for Firan Technology Group
How Does Firan Technology Group's P/E Ratio Compare To Its Peers?
We can tell from its P/E ratio of 22.99 that there is some investor optimism about Firan Technology Group. You can see in the image below that the average P/E (19.0) for companies in the electronic industry is lower than Firan Technology Group's P/E.
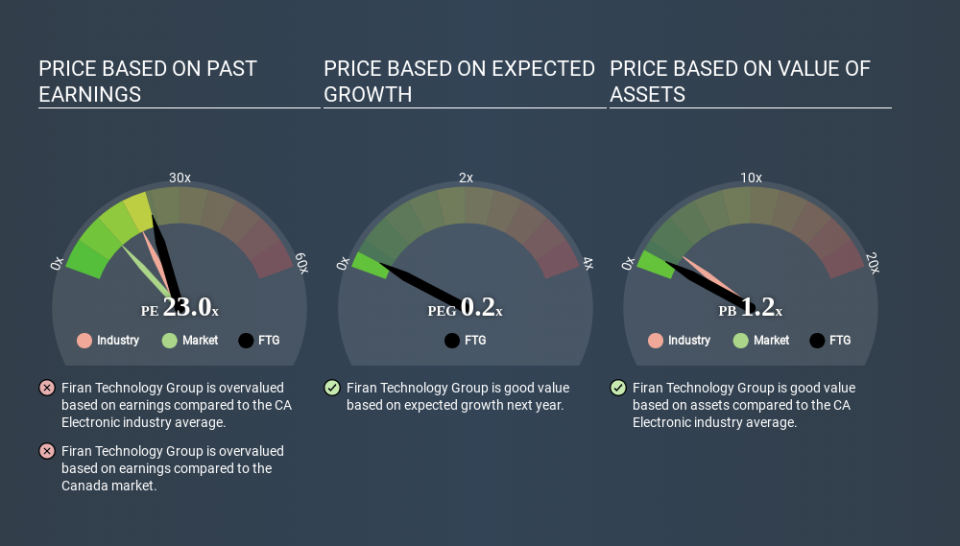
Its relatively high P/E ratio indicates that Firan Technology Group shareholders think it will perform better than other companies in its industry classification. The market is optimistic about the future, but that doesn't guarantee future growth. So investors should delve deeper. I like to check if company insiders have been buying or selling.
How Growth Rates Impact P/E Ratios
Companies that shrink earnings per share quickly will rapidly decrease the 'E' in the equation. Therefore, even if you pay a low multiple of earnings now, that multiple will become higher in the future. A higher P/E should indicate the stock is expensive relative to others -- and that may encourage shareholders to sell.
Firan Technology Group saw earnings per share decrease by 49% last year. And it has shrunk its earnings per share by 6.6% per year over the last five years. This could justify a pessimistic P/E.
Don't Forget: The P/E Does Not Account For Debt or Bank Deposits
It's important to note that the P/E ratio considers the market capitalization, not the enterprise value. Thus, the metric does not reflect cash or debt held by the company. Theoretically, a business can improve its earnings (and produce a lower P/E in the future) by investing in growth. That means taking on debt (or spending its cash).
While growth expenditure doesn't always pay off, the point is that it is a good option to have; but one that the P/E ratio ignores.
So What Does Firan Technology Group's Balance Sheet Tell Us?
Since Firan Technology Group holds net cash of CA$5.1m, it can spend on growth, justifying a higher P/E ratio than otherwise.
The Bottom Line On Firan Technology Group's P/E Ratio
Firan Technology Group trades on a P/E ratio of 23.0, which is above its market average of 11.7. The recent drop in earnings per share might keep value investors away, but the healthy balance sheet means the company retains the potential for future growth. If this growth fails to materialise, the current high P/E could prove to be temporary, as the share price falls. What is very clear is that the market has become significantly more optimistic about Firan Technology Group over the last month, with the P/E ratio rising from 17.2 back then to 23.0 today. For those who prefer to invest with the flow of momentum, that might mean it's time to put the stock on a watchlist, or research it. But the contrarian may see it as a missed opportunity.
Investors have an opportunity when market expectations about a stock are wrong. People often underestimate remarkable growth -- so investors can make money when fast growth is not fully appreciated. So this free visualization of the analyst consensus on future earnings could help you make the right decision about whether to buy, sell, or hold.
Of course you might be able to find a better stock than Firan Technology Group. So you may wish to see this free collection of other companies that have grown earnings strongly.
If you spot an error that warrants correction, please contact the editor at editorial-team@simplywallst.com. This article by Simply Wall St is general in nature. It does not constitute a recommendation to buy or sell any stock, and does not take account of your objectives, or your financial situation. Simply Wall St has no position in the stocks mentioned.
We aim to bring you long-term focused research analysis driven by fundamental data. Note that our analysis may not factor in the latest price-sensitive company announcements or qualitative material. Thank you for reading.
