
 Yahoo Finance
 A Rising Share Price Has Us Looking Closely At Bonterra Energy Corp.'s (TSE:BNE) P/E Ratio

Those holding Bonterra Energy (TSE:BNE) shares must be pleased that the share price has rebounded 31% in the last thirty days. But unfortunately, the stock is still down by 20% over a quarter. But shareholders may not all be feeling jubilant, since the share price is still down 35% in the last year.
All else being equal, a sharp share price increase should make a stock less attractive to potential investors. In the long term, share prices tend to follow earnings per share, but in the short term prices bounce around in response to short term factors (which are not always obvious). So some would prefer to hold off buying when there is a lot of optimism towards a stock. Perhaps the simplest way to get a read on investors' expectations of a business is to look at its Price to Earnings Ratio (PE Ratio). A high P/E ratio means that investors have a high expectation about future growth, while a low P/E ratio means they have low expectations about future growth.
Check out our latest analysis for Bonterra Energy
Does Bonterra Energy Have A Relatively High Or Low P/E For Its Industry?
Bonterra Energy has a P/E ratio of 10.36. The image below shows that Bonterra Energy has a P/E ratio that is roughly in line with the oil and gas industry average (10.4).
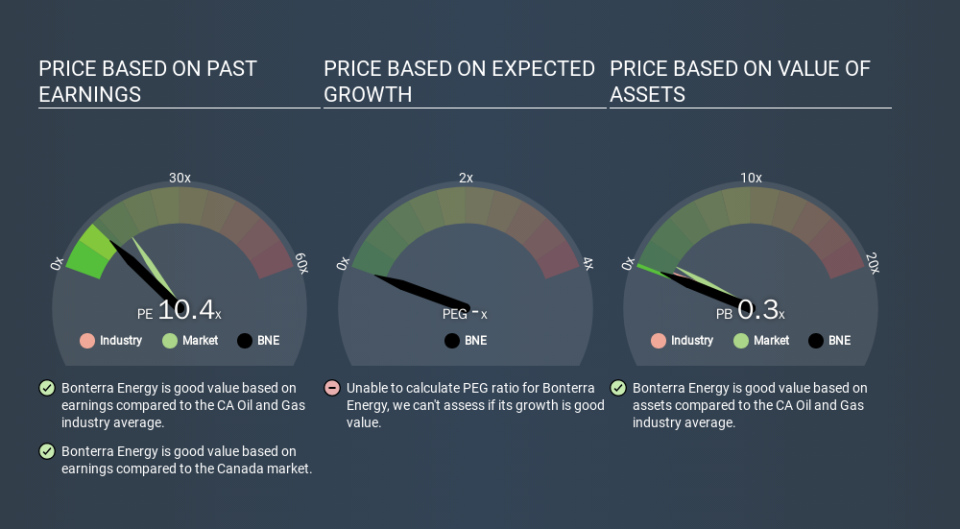
That indicates that the market expects Bonterra Energy will perform roughly in line with other companies in its industry. If the company has better than average prospects, then the market might be underestimating it. I would further inform my view by checking insider buying and selling., among other things.
How Growth Rates Impact P/E Ratios
Probably the most important factor in determining what P/E a company trades on is the earnings growth. If earnings are growing quickly, then the 'E' in the equation will increase faster than it would otherwise. And in that case, the P/E ratio itself will drop rather quickly. Then, a lower P/E should attract more buyers, pushing the share price up.
Bonterra Energy's earnings per share fell by 39% in the last twelve months. And over the longer term (5 years) earnings per share have decreased 33% annually. This growth rate might warrant a below average P/E ratio.
Remember: P/E Ratios Don't Consider The Balance Sheet
It's important to note that the P/E ratio considers the market capitalization, not the enterprise value. Thus, the metric does not reflect cash or debt held by the company. Hypothetically, a company could reduce its future P/E ratio by spending its cash (or taking on debt) to achieve higher earnings.
Spending on growth might be good or bad a few years later, but the point is that the P/E ratio does not account for the option (or lack thereof).
How Does Bonterra Energy's Debt Impact Its P/E Ratio?
Bonterra Energy has net debt worth a very significant 236% of its market capitalization. If you want to compare its P/E ratio to other companies, you must keep in mind that these debt levels would usually warrant a relatively low P/E.
The Bottom Line On Bonterra Energy's P/E Ratio
Bonterra Energy has a P/E of 10.4. That's below the average in the CA market, which is 15.7. When you consider that the company has significant debt, and didn't grow EPS last year, it isn't surprising that the market has muted expectations. What we know for sure is that investors have become more excited about Bonterra Energy recently, since they have pushed its P/E ratio from 7.9 to 10.4 over the last month. If you like to buy stocks that have recently impressed the market, then this one might be a candidate; but if you prefer to invest when there is 'blood in the streets', then you may feel the opportunity has passed.
Investors should be looking to buy stocks that the market is wrong about. If the reality for a company is not as bad as the P/E ratio indicates, then the share price should increase as the market realizes this. So this free visualization of the analyst consensus on future earnings could help you make the right decision about whether to buy, sell, or hold.
Of course, you might find a fantastic investment by looking at a few good candidates. So take a peek at this free list of companies with modest (or no) debt, trading on a P/E below 20.
If you spot an error that warrants correction, please contact the editor at editorial-team@simplywallst.com. This article by Simply Wall St is general in nature. It does not constitute a recommendation to buy or sell any stock, and does not take account of your objectives, or your financial situation. Simply Wall St has no position in the stocks mentioned.
We aim to bring you long-term focused research analysis driven by fundamental data. Note that our analysis may not factor in the latest price-sensitive company announcements or qualitative material. Thank you for reading.
