
 Yahoo Finance
 A Rising Share Price Has Us Looking Closely At Callaway Golf Company's (NYSE:ELY) P/E Ratio

Callaway Golf (NYSE:ELY) shareholders are no doubt pleased to see that the share price has bounced 33% in the last month alone, although it is still down 51% over the last quarter. But shareholders may not all be feeling jubilant, since the share price is still down 37% in the last year.
All else being equal, a sharp share price increase should make a stock less attractive to potential investors. While the market sentiment towards a stock is very changeable, in the long run, the share price will tend to move in the same direction as earnings per share. So some would prefer to hold off buying when there is a lot of optimism towards a stock. One way to gauge market expectations of a stock is to look at its Price to Earnings Ratio (PE Ratio). A high P/E ratio means that investors have a high expectation about future growth, while a low P/E ratio means they have low expectations about future growth.
View our latest analysis for Callaway Golf
How Does Callaway Golf's P/E Ratio Compare To Its Peers?
Callaway Golf has a P/E ratio of 12.93. As you can see below Callaway Golf has a P/E ratio that is fairly close for the average for the leisure industry, which is 12.9.
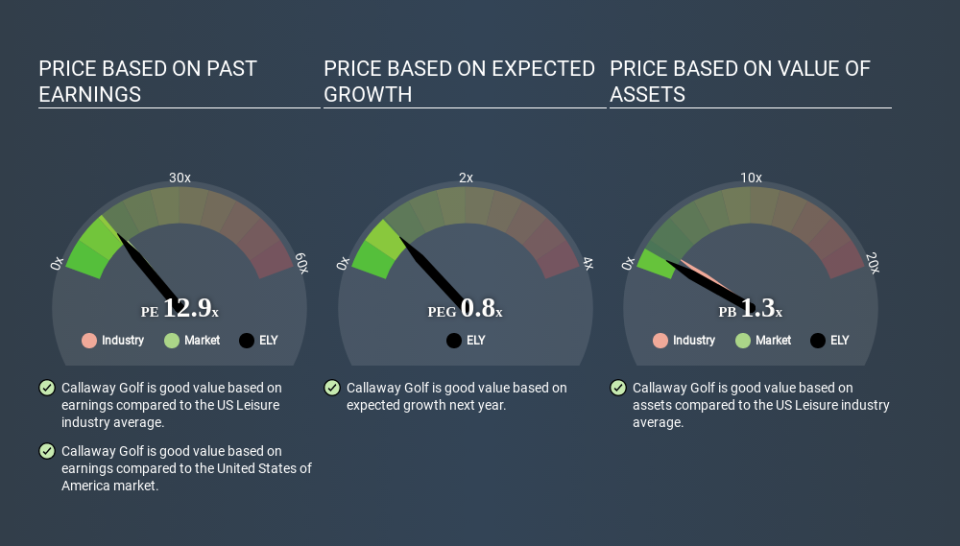
That indicates that the market expects Callaway Golf will perform roughly in line with other companies in its industry. The company could surprise by performing better than average, in the future. Checking factors such as director buying and selling. could help you form your own view on if that will happen.
How Growth Rates Impact P/E Ratios
When earnings fall, the 'E' decreases, over time. That means unless the share price falls, the P/E will increase in a few years. Then, a higher P/E might scare off shareholders, pushing the share price down.
Callaway Golf's earnings per share fell by 24% in the last twelve months. But EPS is up 32% over the last 5 years. And over the longer term (3 years) earnings per share have decreased 25% annually. This growth rate might warrant a low P/E ratio.
Don't Forget: The P/E Does Not Account For Debt or Bank Deposits
Don't forget that the P/E ratio considers market capitalization. That means it doesn't take debt or cash into account. Theoretically, a business can improve its earnings (and produce a lower P/E in the future) by investing in growth. That means taking on debt (or spending its cash).
Spending on growth might be good or bad a few years later, but the point is that the P/E ratio does not account for the option (or lack thereof).
How Does Callaway Golf's Debt Impact Its P/E Ratio?
Callaway Golf has net debt equal to 49% of its market cap. You'd want to be aware of this fact, but it doesn't bother us.
The Bottom Line On Callaway Golf's P/E Ratio
Callaway Golf has a P/E of 12.9. That's around the same as the average in the US market, which is 13.7. Given it has some debt, but didn't grow last year, the P/E indicates the market is expecting higher profits ahead for the business. What is very clear is that the market has become more optimistic about Callaway Golf over the last month, with the P/E ratio rising from 9.7 back then to 12.9 today. For those who prefer to invest with the flow of momentum, that might mean it's time to put the stock on a watchlist, or research it. But the contrarian may see it as a missed opportunity.
Investors have an opportunity when market expectations about a stock are wrong. If the reality for a company is not as bad as the P/E ratio indicates, then the share price should increase as the market realizes this. So this free visual report on analyst forecasts could hold the key to an excellent investment decision.
Of course you might be able to find a better stock than Callaway Golf. So you may wish to see this free collection of other companies that have grown earnings strongly.
If you spot an error that warrants correction, please contact the editor at editorial-team@simplywallst.com. This article by Simply Wall St is general in nature. It does not constitute a recommendation to buy or sell any stock, and does not take account of your objectives, or your financial situation. Simply Wall St has no position in the stocks mentioned.
We aim to bring you long-term focused research analysis driven by fundamental data. Note that our analysis may not factor in the latest price-sensitive company announcements or qualitative material. Thank you for reading.
