
 Yahoo Finance
 RF Capital Group (TSE:RCG) shareholders have endured a 41% loss from investing in the stock five years ago
In order to justify the effort of selecting individual stocks, it's worth striving to beat the returns from a market index fund. But even the best stock picker will only win with some selections. So we wouldn't blame long term RF Capital Group Inc. (TSE:RCG) shareholders for doubting their decision to hold, with the stock down 56% over a half decade. The falls have accelerated recently, with the share price down 15% in the last three months.
Now let's have a look at the company's fundamentals, and see if the long term shareholder return has matched the performance of the underlying business.
Check out our latest analysis for RF Capital Group
While the efficient markets hypothesis continues to be taught by some, it has been proven that markets are over-reactive dynamic systems, and investors are not always rational. One way to examine how market sentiment has changed over time is to look at the interaction between a company's share price and its earnings per share (EPS).
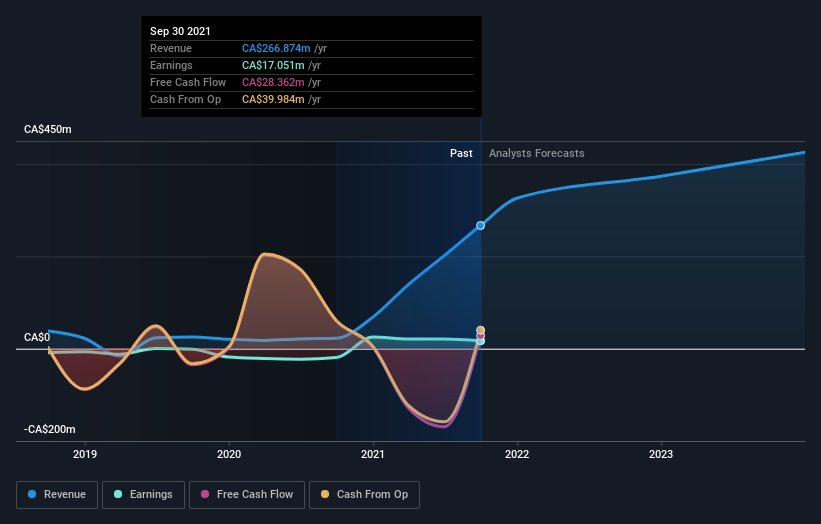
During five years of share price growth, RF Capital Group moved from a loss to profitability. Most would consider that to be a good thing, so it's counter-intuitive to see the share price declining. Other metrics might give us a better handle on how its value is changing over time.
It could be that the revenue decline of 12% per year is viewed as evidence that RF Capital Group is shrinking. That could explain the weak share price.
You can see below how earnings and revenue have changed over time (discover the exact values by clicking on the image).
It's probably worth noting we've seen significant insider buying in the last quarter, which we consider a positive. That said, we think earnings and revenue growth trends are even more important factors to consider. You can see what analysts are predicting for RF Capital Group in this interactive graph of future profit estimates.
What about the Total Shareholder Return (TSR)?
We'd be remiss not to mention the difference between RF Capital Group's total shareholder return (TSR) and its share price return. The TSR is a return calculation that accounts for the value of cash dividends (assuming that any dividend received was reinvested) and the calculated value of any discounted capital raisings and spin-offs. RF Capital Group's TSR of was a loss of 41% for the 5 years. That wasn't as bad as its share price return, because it has paid dividends.
A Different Perspective
RF Capital Group shareholders gained a total return of 2.9% during the year. Unfortunately this falls short of the market return. But at least that's still a gain! Over five years the TSR has been a reduction of 7% per year, over five years. It could well be that the business is stabilizing. While it is well worth considering the different impacts that market conditions can have on the share price, there are other factors that are even more important. Take risks, for example - RF Capital Group has 1 warning sign we think you should be aware of.
There are plenty of other companies that have insiders buying up shares. You probably do not want to miss this free list of growing companies that insiders are buying.
Please note, the market returns quoted in this article reflect the market weighted average returns of stocks that currently trade on CA exchanges.
Have feedback on this article? Concerned about the content? Get in touch with us directly. Alternatively, email editorial-team (at) simplywallst.com.
This article by Simply Wall St is general in nature. We provide commentary based on historical data and analyst forecasts only using an unbiased methodology and our articles are not intended to be financial advice. It does not constitute a recommendation to buy or sell any stock, and does not take account of your objectives, or your financial situation. We aim to bring you long-term focused analysis driven by fundamental data. Note that our analysis may not factor in the latest price-sensitive company announcements or qualitative material. Simply Wall St has no position in any stocks mentioned.
