
 Yahoo Finance
 Rexnord (RXN) Earnings Surpass Estimates in Q1, Sales Lag
Rexnord Corporation RXN reported better-than-expected results for the first quarter of fiscal 2020 (ended Jun 30, 2019). It pulled a positive earnings surprise of 11.6%.
This machinery company’s adjusted earnings in the reported quarter were 48 cents per share, surpassing the Zacks Consensus Estimate of 43 cents. Also, the bottom line gained 17.1% from the year-ago quarter number of 41 cents on healthy organic sales, buyouts and margin improvement.
Core Sales and Acquisitions Drive Revenues
In the reported quarter, Rexnord’s net sales were $508.3 million, increasing 0.9% year over year. The improvement was driven by a 2% contribution from core sales growth and 1% from net positive impact of acquisitions/divestitures, partially offset by a 2% adverse impact of foreign currency translation. However, the company’s net sales lagged the Zacks Consensus Estimate of $513.7 million by 1%.
It is worth noting here that product line simplification initiatives had an adverse 150 basis points (bps) impact on sales.
The company reports results under two segments — Process & Motion Control, and Water Management. The quarterly segmental results are briefly discussed below:
Revenues from Process & Motion Control totaled $330.1 million, decreasing 1% year over year. It represented 64.9% of net sales. Core sales in the quarter grew 1% as healthy growth in North America end market was more than offset by product line simplification actions and weakness in Asia and Europe markets. The acquisition of Centa Power added 1% to sales growth while unfavorable movements in foreign currencies negatively impacted results by 3%.
Water Management revenues, representing 35.1% of net sales, were $178.2 million, up 4% year over year. Core sales in the quarter grew 4% backed by demand growth in building construction markets in North America. However, product line simplification actions played spoilsport in the quarter.
Gross Margin Improve Y/Y
In the reported quarter, Rexnord’s cost of sales decreased 0.5% year over year to $306.7 million. It represented 60.3% of net sales versus 61.2% recorded in the year-ago quarter. Gross margin increased 90 bps to 39.7%. Selling, general and administrative expenses of $109.5 million decreased 2.1% year over year and represented 21.5% of net sales versus 22.2% in the year-ago quarter.
Adjusted earnings before interest, tax, depreciation and amortization (EBITDA) were $111 million, up 5.7% year over year. Adjusted EBITDA margin was 21.8%, up roughly 90 bps from the prior-year quarter. For the Process & Motion Control segment, adjusted EBITDA margin increased 90 bps to 22.4% while that for the Water Management segment expanded 100 bps to 26.4%.
Adjusted tax rate in the quarter was 23.6% versus 26.2% in the year-ago quarter.
Balance Sheet and Cash Flow
Exiting the fiscal first quarter, Rexnord had cash and cash equivalents of $271.8 million, reflecting a 7.1% decline from $292.5 million recorded in the last reported quarter. Long-term debt increased 2.2% sequentially to $1,263.5 million. Notably, the company repaid $3.9 million of debt in the fiscal first quarter.
In the quarter under review, it generated net cash of $19 million from operating activities, reflecting 17.3% year-over-year growth. It decreased the capital investment for purchasing property, plant and equipment by 46.8% from the previous year to $5.9 million. Free cash flow was $13.1 million, increasing 156.9% from the year-ago figure.
Outlook
For fiscal 2020, Rexnord anticipates benefiting from operational execution and supply-chain optimization, and footprint-repositioning programs (“SCOFR”). As noted, the company is working on the third phase of SCOFR initiatives. The third leg of this program, likely to be completed in fiscal 2021, is anticipated to result in structural cost reductions (annualized) of $20 million by fiscal 2022.
The Process & Motion Control segment will likely benefit from strengthening demand in global process industries and global commercial aerospace end markets. The industrial distribution business in the United States and Canada will probably increase as well. However, the industrial distribution business in Europe will likely be weak.
Sales in the Water Management segment will likely gain from a solid product portfolio and healthy demand from non-residential construction markets of the United States and Canada, especially from institutional clients.
For fiscal 2020, the company maintained its projections, with core sales still likely to grow in a low-single digit. Product line simplification initiatives are predicted to have an adverse impact of 150-200 bps on sales (same as the previous projection).
Adjusted EBITDA guidance is maintained at $460-$475 million. Net income from continuing operations will likely be $181-$191 million, slightly above previously mentioned $180-$190 million. The effective tax rate is expected to be roughly 26-27%.
Capital expenditure is anticipated to be below 2.5% of sales. Free cash will exceed net income. Interest expenses are predicted to be approximately $65 million, down from the previously stated $67 million.
Rexnord Corporation Price, Consensus and EPS Surprise
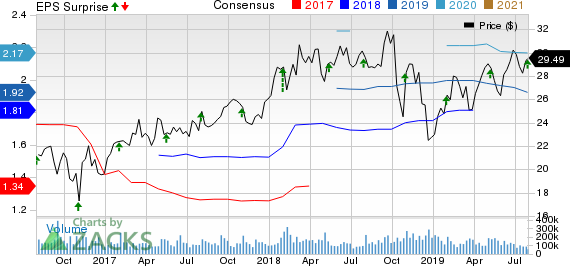
Rexnord Corporation price-consensus-eps-surprise-chart | Rexnord Corporation Quote
Zacks Rank & Stocks to Consider
With a market capitalization of approximately $3.1 billion, Rexnord currently carries a Zacks Rank #3 (Hold).
Some better-ranked stocks in the Zacks Industrial Products sector are Roper Technologies, Inc. ROP, DXPE Enterprises, Inc. DXPE and Dover Corporation DOV. All these stocks currently carry a Zacks Rank #2 (Buy). You can see the complete list of today’s Zacks #1 Rank (Strong Buy) stocks here.
In the past 60 days, earnings estimates for these companies have improved for the current year. Further, average earnings surprise for the last four quarters was 6.92% for Roper, 48.47% for DXP Enterprises and 6.91% for Dover.
More Stock News: This Is Bigger than the iPhone!
It could become the mother of all technological revolutions. Apple sold a mere 1 billion iPhones in 10 years but a new breakthrough is expected to generate more than 27 billion devices in just 3 years, creating a $1.7 trillion market.
Zacks has just released a Special Report that spotlights this fast-emerging phenomenon and 6 tickers for taking advantage of it. If you don't buy now, you may kick yourself in 2020.
Click here for the 6 trades >>
Want the latest recommendations from Zacks Investment Research? Today, you can download 7 Best Stocks for the Next 30 Days. Click to get this free report
Roper Technologies, Inc. (ROP) : Free Stock Analysis Report
Rexnord Corporation (RXN) : Free Stock Analysis Report
Dover Corporation (DOV) : Free Stock Analysis Report
DXP Enterprises, Inc. (DXPE) : Free Stock Analysis Report
To read this article on Zacks.com click here.
